hi,
would like to here from others what they think:
INTRO:
I'm starting to code a range bar indicator and came across a simple situation where I would like to have some thoughts of others.
Three rules of range bars:
Each range bar must have a high/low range that equals the specified range.
Each range bar must open outside the high/low range of the previous bar.
Each range bar must close at either its high or its low.
Read more: http://www.investopedia.com/articles...#ixzz2AmzNdRWA
POINT of consideration:
this is relevant for past data .. based on OHLC data ....
e.g. MT4 platform but probably also other trading platforms
Pre-assumption: I use some extremer values to make the point:
- RangeBar High 4pips
- assuming first bar in data calculation:
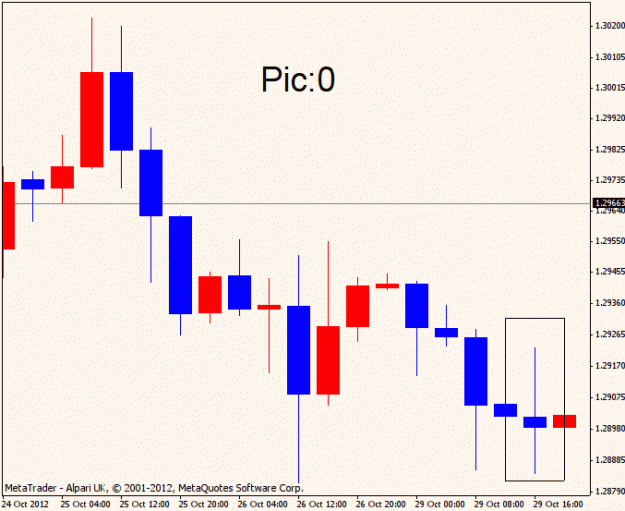
PIC:0: source past OHLC source bar
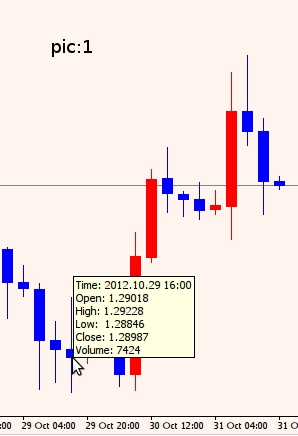
PIC:1: O= 1.29018, H=1.29228, L=1.28846, C= 1.28987
total range = 38.2pips
From Open to Low = 17.2 pips
From Open to High = 21 pips
From Low to Close = 14.1 pips
From High to Close 24.1 pips
====== PROBLEMS: for input
What is the most sensible way do I draw range bars????
1.
we know one thing for sure: the first RangeBar(Rb) opens at:
RbO= 1.29018
now the problem points:
* do I go first Down till the LOW and than come UP till the HIGH and go back Down till the CLOSE???
* or is it more sensible to go first UP till the HIGH and than come till the LOW and back UP till the CLOSE???
Cheers
Ati
would like to here from others what they think:
INTRO:
I'm starting to code a range bar indicator and came across a simple situation where I would like to have some thoughts of others.
Three rules of range bars:
Each range bar must have a high/low range that equals the specified range.
Each range bar must open outside the high/low range of the previous bar.
Each range bar must close at either its high or its low.
Read more: http://www.investopedia.com/articles...#ixzz2AmzNdRWA
POINT of consideration:
this is relevant for past data .. based on OHLC data ....
e.g. MT4 platform but probably also other trading platforms
Pre-assumption: I use some extremer values to make the point:
- RangeBar High 4pips
- assuming first bar in data calculation:
PIC:0: source past OHLC source bar
PIC:1: O= 1.29018, H=1.29228, L=1.28846, C= 1.28987
total range = 38.2pips
From Open to Low = 17.2 pips
From Open to High = 21 pips
From Low to Close = 14.1 pips
From High to Close 24.1 pips
====== PROBLEMS: for input
What is the most sensible way do I draw range bars????
1.
we know one thing for sure: the first RangeBar(Rb) opens at:
RbO= 1.29018
now the problem points:
* do I go first Down till the LOW and than come UP till the HIGH and go back Down till the CLOSE???
* or is it more sensible to go first UP till the HIGH and than come till the LOW and back UP till the CLOSE???
Cheers
Ati
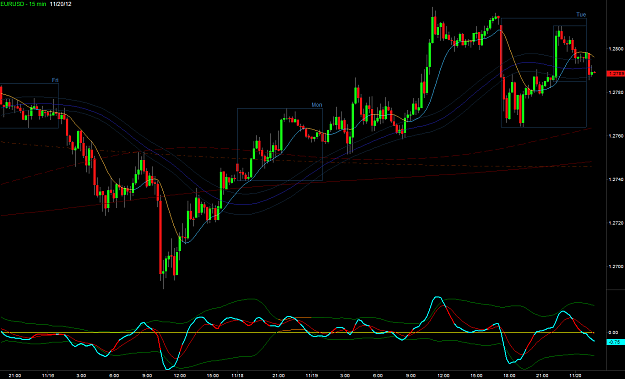
Attached Image (click to enlarge)
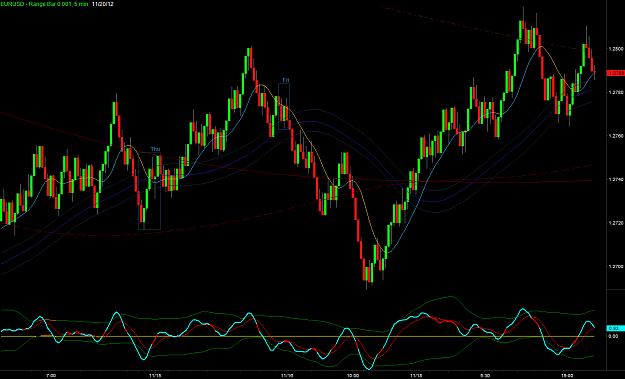
Attached Image
Money is important, Love is essential.