This system is quite different than most here on Forexfactory. I have traded it in various formats since 2009. I am not here to boast how great it is or how it is the truth in trading but I can say for certain it is profitable and can be quite enjoyable to trade.
I have been deeply influenced by Michael Jardine, Kevin Haggerty, Austin Passamonte and a mysterious guy named Phat Dat from an irc futures room many years ago. Basically what I learned from these experienced traders is that markets are constantly backfilling - or mean reverting -and that if you want to catch huge waves you have to get in way before the breakout.
Weekly meantrades is about catching the really big intraday trades and holding on for substantial targets.
How to setup your charts
First thing you need is to modify your fibonacci levels. I do not trade the normal ratios as they are, what I call, "crowded" levels. I don't want to be in a hurry to get in or out of my trades. I prefer things to develop quietly.
I use the following levels on my fib tool and none other:
1
.5
0
3.77
-3.77
6.11
-6.11
9.88
-9.88
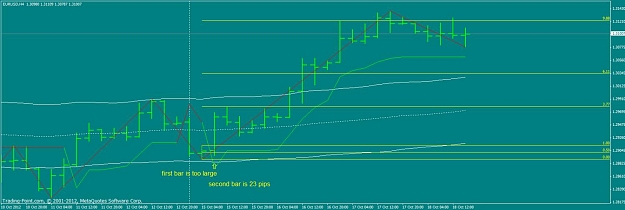
At the beginning of each trading week open your four hour chart and draw the fibo from the high to low on the first or second bar. I usually draw the fib on the smaller of the two bars but do not draw it on a bar smaller than 20 pips. If neither the first or second bar are larger than 20 pips I will wait until the first four hour bar which satisfies this requirement. The purpose of this is to establish the early volatility for the week ahead. These levels are not trying to predict anything. They are merely to draw a decent range in order to take trades as the week develops.
Second you need to apply 3 more indicators with the following settings:
Stochastics set at 10,3,3
Supertrend nrp at 10 and 1.5
Keltner Bands at 50 50 1.5
Note, we will draw the ratios on the 4 hour chart but take the signals on the hourly chart.
Trade signal
Usually the first signal will happen in the late London session if not for sure the next day there will be a signal.
You are looking to buy the bounce or sell the spike and hold on until we reach profit objective.
Once price has traded to one of the ratio levels you are going to look for a reversal. The following signal can develop over 36 hours, it need not happen in just an hour or two. Often times quick reversals are too fast to get into and risk getting filled at the worst possible price.
First, the stochastics must cross over for longs the crossover needs to occur below the 20 level, shorts above the 80 level.
Second the supertrend must also reverse. For longs it needs to cross upwards, for shorts it needs to cross downwards.
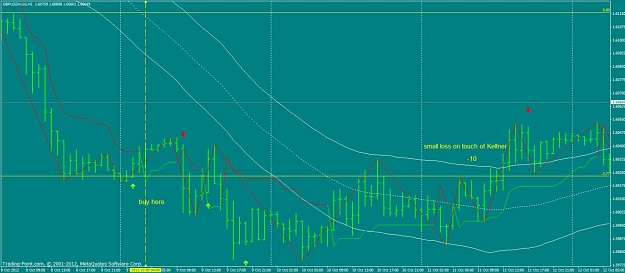
Third, price must touch the outside of the Keltner band and begin to reverse. This ensures that there is decent volatility and the chances of the market following through are much better. Small subtle note to not take trades where the price bar has already crossed through the median band already, this just creates a larger risk which may or may not bounce back and stop you out.
Stops
I am currently using 200 pip stops, previously I have used swing high and swing low but I found this only works when markets are highly volatile. Currently volatility is extremely low and thus we are not snapping back as swiftly as necessary to rely on swing levels to prevent stop runs. When volatility rises it easy enough to check the ATR reading on the daily chart and assess what is a reasonable level to avoid intraday stop runs.
Position sizing
I usually trade on 10 to 1 margin. So if I have a 10,000 dollar account I will not trade more than a total of 100,000 position size for the total account. That means if I am trading 5 markets I will not trade each position with more than 20,000.
Often times I will get a second entry signal with the first signal in a negative balance. As long as my position size is within my risk parameters, I will enter that second lot. I prefer to only enter if the signal provides a price improvement to lower my average cost, I am not a big fan of averaging up on an intraday trade strategy.
Taking profits
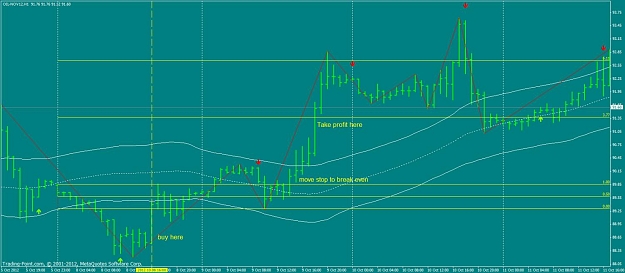
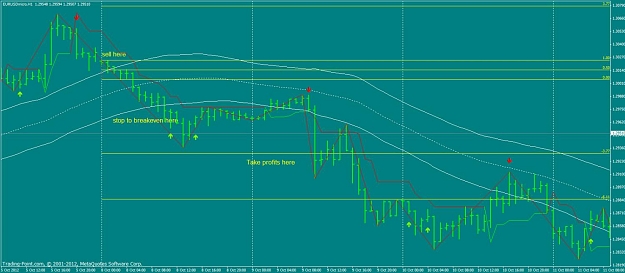
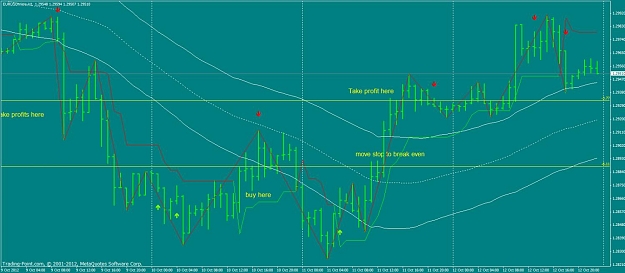
Once price has successfully touched the opposite end of the Keltner band, we want to move stops to break even. Our target is the first ratio level above the Keltner band for longs and the first ratio level below for shorts.
Many traders like to take partial or full profits at this point. However after trading for quite a few years I realize that getting stopped out breakeven is much better than missing out on larger profits. This is a mathematical quandary and the research suggests that the longer you leave your profitable trade open the better change you have of making more money, not less. Even though this means you will invariably see nice gains disappear, the one trade you take off too soon which makes up for all the stop outs is an impossibility without staying in the market "risk free" for a little longer.
I currently trade EUR/USD GBP/USD, EUR/JPY, Gold, Oil and occasionally AUD/USD.
I find that on average I can get 2 decent signals per week per pair. After the third signal, the ratio levels tend to degrade in their accurate reading of volatility and prefer to wait until the next week to get a better range to trade from.
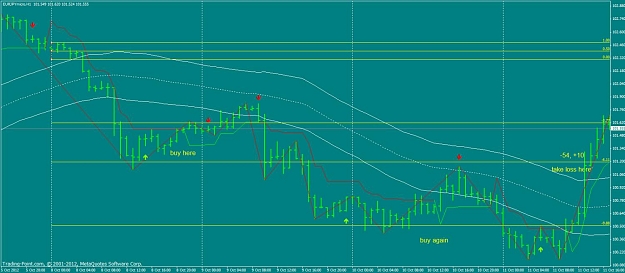
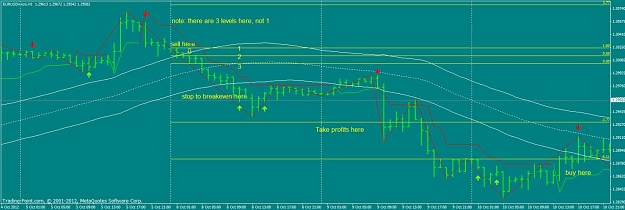
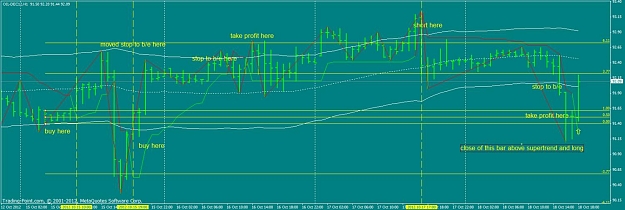
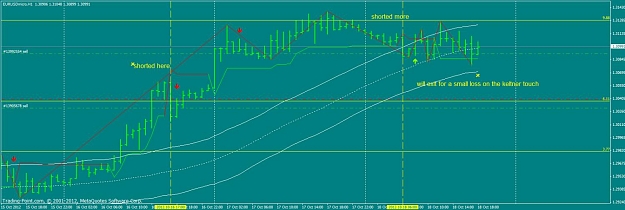
I will post some trades from this week below.
I have been deeply influenced by Michael Jardine, Kevin Haggerty, Austin Passamonte and a mysterious guy named Phat Dat from an irc futures room many years ago. Basically what I learned from these experienced traders is that markets are constantly backfilling - or mean reverting -and that if you want to catch huge waves you have to get in way before the breakout.
Weekly meantrades is about catching the really big intraday trades and holding on for substantial targets.
How to setup your charts
First thing you need is to modify your fibonacci levels. I do not trade the normal ratios as they are, what I call, "crowded" levels. I don't want to be in a hurry to get in or out of my trades. I prefer things to develop quietly.
I use the following levels on my fib tool and none other:
1
.5
0
3.77
-3.77
6.11
-6.11
9.88
-9.88
At the beginning of each trading week open your four hour chart and draw the fibo from the high to low on the first or second bar. I usually draw the fib on the smaller of the two bars but do not draw it on a bar smaller than 20 pips. If neither the first or second bar are larger than 20 pips I will wait until the first four hour bar which satisfies this requirement. The purpose of this is to establish the early volatility for the week ahead. These levels are not trying to predict anything. They are merely to draw a decent range in order to take trades as the week develops.
Second you need to apply 3 more indicators with the following settings:
Stochastics set at 10,3,3
Supertrend nrp at 10 and 1.5
Keltner Bands at 50 50 1.5
Note, we will draw the ratios on the 4 hour chart but take the signals on the hourly chart.
Trade signal
Usually the first signal will happen in the late London session if not for sure the next day there will be a signal.
You are looking to buy the bounce or sell the spike and hold on until we reach profit objective.
Once price has traded to one of the ratio levels you are going to look for a reversal. The following signal can develop over 36 hours, it need not happen in just an hour or two. Often times quick reversals are too fast to get into and risk getting filled at the worst possible price.
First, the stochastics must cross over for longs the crossover needs to occur below the 20 level, shorts above the 80 level.
Second the supertrend must also reverse. For longs it needs to cross upwards, for shorts it needs to cross downwards.
Third, price must touch the outside of the Keltner band and begin to reverse. This ensures that there is decent volatility and the chances of the market following through are much better. Small subtle note to not take trades where the price bar has already crossed through the median band already, this just creates a larger risk which may or may not bounce back and stop you out.
Stops
I am currently using 200 pip stops, previously I have used swing high and swing low but I found this only works when markets are highly volatile. Currently volatility is extremely low and thus we are not snapping back as swiftly as necessary to rely on swing levels to prevent stop runs. When volatility rises it easy enough to check the ATR reading on the daily chart and assess what is a reasonable level to avoid intraday stop runs.
Position sizing
I usually trade on 10 to 1 margin. So if I have a 10,000 dollar account I will not trade more than a total of 100,000 position size for the total account. That means if I am trading 5 markets I will not trade each position with more than 20,000.
Often times I will get a second entry signal with the first signal in a negative balance. As long as my position size is within my risk parameters, I will enter that second lot. I prefer to only enter if the signal provides a price improvement to lower my average cost, I am not a big fan of averaging up on an intraday trade strategy.
Taking profits
Once price has successfully touched the opposite end of the Keltner band, we want to move stops to break even. Our target is the first ratio level above the Keltner band for longs and the first ratio level below for shorts.
Many traders like to take partial or full profits at this point. However after trading for quite a few years I realize that getting stopped out breakeven is much better than missing out on larger profits. This is a mathematical quandary and the research suggests that the longer you leave your profitable trade open the better change you have of making more money, not less. Even though this means you will invariably see nice gains disappear, the one trade you take off too soon which makes up for all the stop outs is an impossibility without staying in the market "risk free" for a little longer.
I currently trade EUR/USD GBP/USD, EUR/JPY, Gold, Oil and occasionally AUD/USD.
I find that on average I can get 2 decent signals per week per pair. After the third signal, the ratio levels tend to degrade in their accurate reading of volatility and prefer to wait until the next week to get a better range to trade from.
I will post some trades from this week below.
Attached File(s)