mike i think this question was asked here before, but as ur faithful disciple i would like to hear it from u .. why more often price retraces back to the turning point ? like for instance for a beob ,buob, pin etc..... is it because of supply and demand ?
Ignored
Yes...well everything is supply and demand. But you have so many traders doing different things. If price breaks out often price wants to come back to retest that breakout point. People take profit and sell back into that breakout point where supply/demand will be heavily located again since this was the last major point of buying/selling.
This is often why if you buy a break of a buob/pin/price pattern/etc and get your stop to breakeven you get stopped out before the LARGER move. price hits a trouble area, gets some weak selling price bounces back to the point of origin(breakout point) fresh buyers come back in to get back on the bus
Doesn't mean it happens every time, but the market tends to not move in a straight line too much
|
Joined Dec 2010
|
Status: Reward Of Simple Approach
|165 Posts
Hello,
I try to take setup from daily s/r level and h4 PA. So this is my first setup of this kind of strategy. LCS on daily and double or more lows, so i paint it as LLS, then was PBTCB and retest, now wa second retest of this level. On my h4 chart there is shutting star and daily close is below this level. So short is on, am I right in this setup ??
PS. SL above pin from h4 = high of a daily bar + 13 pips (spread on my broker) + 10 pips.
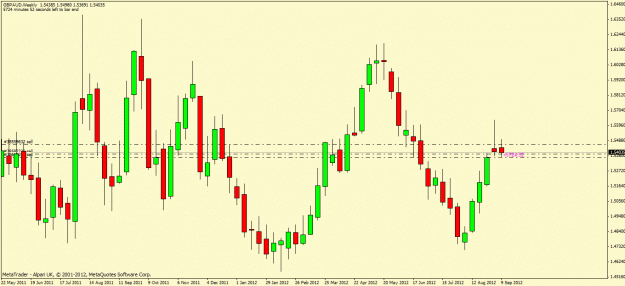
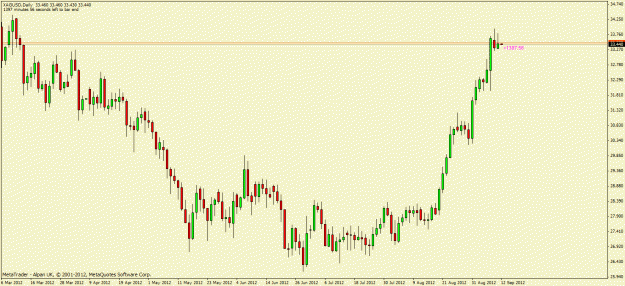
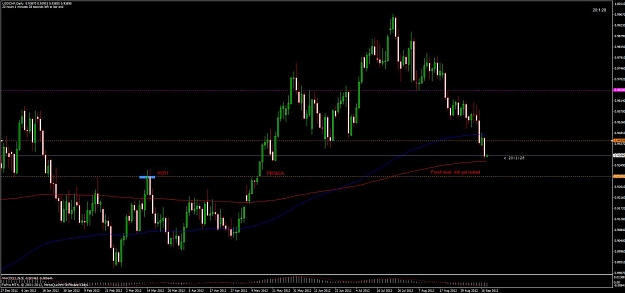
I would like to see that move down into the confluenced area at 1.9300.
Obvious PPZ
RN
61.8% ret
Untested HCR at Swing point
Space
Looks like the perfect place for mike, jarroo, classic J16 to come together. Currently biased to look for bullish PA here, but open to a bearish signal if price close below the 9300 RN.
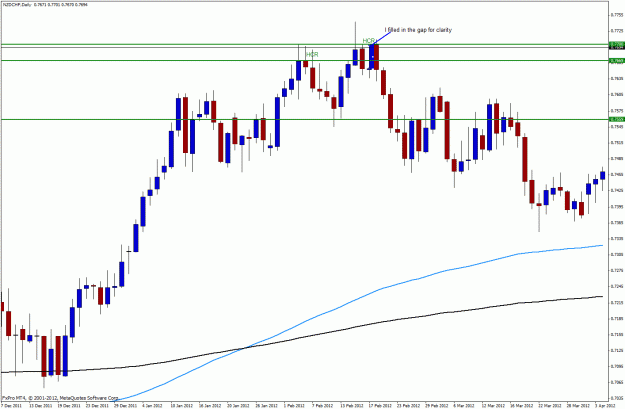
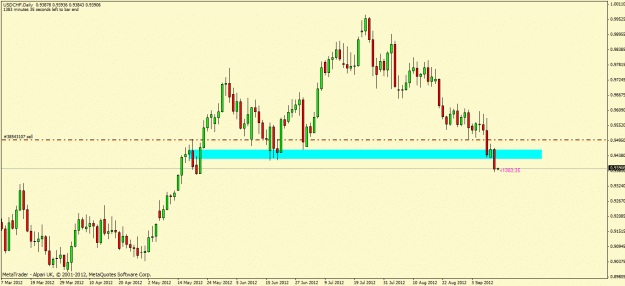
Hi Jarroo please can you clarify for me something that I am not clear on.
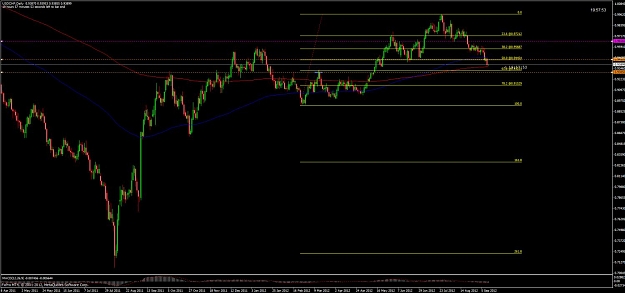
On the recent NZD CHF chart the the HCR is on the top of a bearish candle. I appreciate it is at the highest point of the swing high. I had it in my head that HCR should be on the top of a bull candle (as that is where the candle closed) and the opposite way around for LCS (at the bottom of a bearish candle).
Or is this the the Damn Gaps and you do take the level at the highest point in this example.
I hope my question makes sense and thanks once again for your help, Alex....
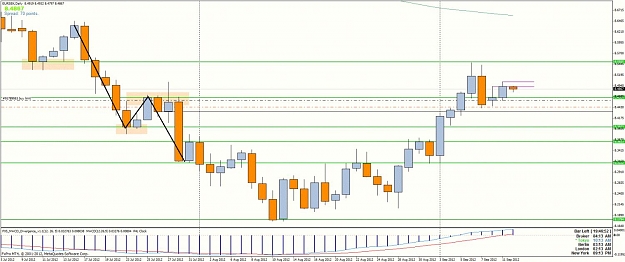
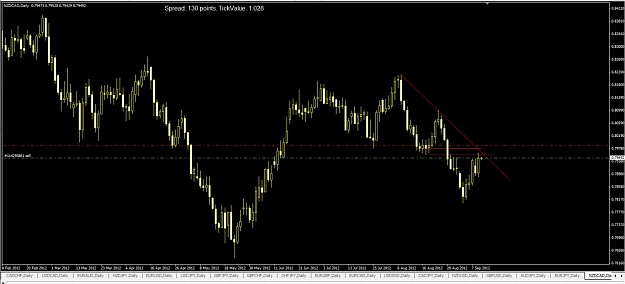
Another question about levels . On this chart (daily aud/cad) we have hcr level from past, which was pbt&cb and next daily bar pbt&ca it. So was there right setup to take short ? Or maybe some other comments ?
Ignored
Yes, very valid to take Short but it failed as Resistance . .
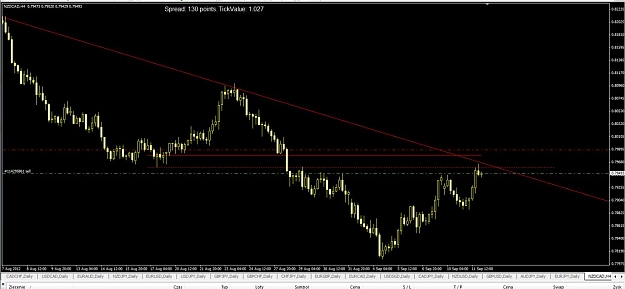
Jarroo are you watching this potential setup yourself ? What are your thoughts on it as a short opportunity ? Since price has tested the level (low) and closes above will you be looking for a long at a retrace the the LCS ?
Price did not touch the 1.9370 yet . .let's wait until Price touches it and than we'll see where it Closes on the Daily to give us more information to where Price may be heading.
Indicators show the past. Price Action "Indicates" the future.
I am assuming that this setup will be valid only if today's candle closes below the HCR level on the left, right? And that is when u'll enter, isn't it?
Ignored
No, that past HCR level has been tested already and Price "should" be reactive to the most current levels.
Indicators show the past. Price Action "Indicates" the future.
I just started to play with this risk/value calculator and my question is how many pips do you set as SL? As I have seen in most cases the price bounces back a little bit which means we have to have at lest 50-100pips right?