Let me provide specific answers to the questions you asked for your benefits and others:
How did you determine 1000 pips range..Assuming it is a classical range for the past 10 years,between the high and low, I can understand that concept
The 1000 pips range as you rightly mentioned is a classic range for the past 20 years and more. Why 1000 pips? Read my post on "Benefiting from the greed of the big boys". The range is 1000 pips each because the "big boys" will usually push and manipulate the price to get 1000 pips. Study the charts and you will see clusters of weekly candles around these areas. These are areas of solid S/R areas. Pay attention to the body of the weekly candles and not the pins (wicks). Furthermore, if you look at fx in terms of actual currency. a move from £1.53 to £1.63 is actually 10 pence . Finally, majority of fx users (not speculators/traders) buy/sell at predetermined levels which are usually round figures.
2 You say divide that into 2 500 pips range. I assume you are saying that, because volatility year to tear may differ and therefore a 500 pi range is good number to work with.
500 pips is simply determined by 50% retrace in fx. Majority of the times, every fx moves (bear/bull) is followed by 50% retrace. Again check how the weekly candle react around these levels. The secret of fx are in the weekly
3 What I do not understand is how do you come to the conclusion of marking 1.43. 1.53. 1.63 etc on USD/GBP as the numbers from where to start the count of 500 pips from there
1.43, 1.53, 1.63, etc is simply an outcome of my research over the years. For example, 1.5300 has not been broken since 2009. Again study how the weekly candles reacts around these levels.
Would appreciate your clarification and would also like your opinion on my earlier question where I marked the daily, weekly and monthly ranges and started counting from the lowest point on the chart. Is that correct or helpful.
As for the ranges you indicated, the important price range is the one depicted by Price Action and are easily identified by the weekly pins, forget the daily and monthly ranges. For the ranges you mentioned, post your chart for easy analysis.
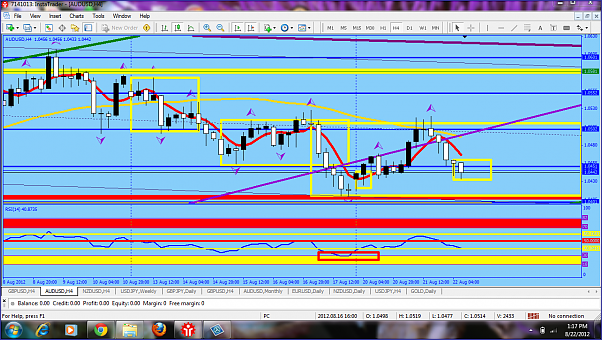
I attached two weekly and one monthly charts from the platform on another PC for better understanding of the above explanation. If you have further questions, do not hesitate to post them here. I will respond to them as time permits.
How did you determine 1000 pips range..Assuming it is a classical range for the past 10 years,between the high and low, I can understand that concept
The 1000 pips range as you rightly mentioned is a classic range for the past 20 years and more. Why 1000 pips? Read my post on "Benefiting from the greed of the big boys". The range is 1000 pips each because the "big boys" will usually push and manipulate the price to get 1000 pips. Study the charts and you will see clusters of weekly candles around these areas. These are areas of solid S/R areas. Pay attention to the body of the weekly candles and not the pins (wicks). Furthermore, if you look at fx in terms of actual currency. a move from £1.53 to £1.63 is actually 10 pence . Finally, majority of fx users (not speculators/traders) buy/sell at predetermined levels which are usually round figures.
2 You say divide that into 2 500 pips range. I assume you are saying that, because volatility year to tear may differ and therefore a 500 pi range is good number to work with.
500 pips is simply determined by 50% retrace in fx. Majority of the times, every fx moves (bear/bull) is followed by 50% retrace. Again check how the weekly candle react around these levels. The secret of fx are in the weekly
3 What I do not understand is how do you come to the conclusion of marking 1.43. 1.53. 1.63 etc on USD/GBP as the numbers from where to start the count of 500 pips from there
1.43, 1.53, 1.63, etc is simply an outcome of my research over the years. For example, 1.5300 has not been broken since 2009. Again study how the weekly candles reacts around these levels.
Would appreciate your clarification and would also like your opinion on my earlier question where I marked the daily, weekly and monthly ranges and started counting from the lowest point on the chart. Is that correct or helpful.
As for the ranges you indicated, the important price range is the one depicted by Price Action and are easily identified by the weekly pins, forget the daily and monthly ranges. For the ranges you mentioned, post your chart for easy analysis.
I attached two weekly and one monthly charts from the platform on another PC for better understanding of the above explanation. If you have further questions, do not hesitate to post them here. I will respond to them as time permits.
DislikedArticulate
Thank you very much for your prompt response. I appreciate it it very much
However while I understand the weekly pins and the way to anlayze support and resistance and also the 50ppa method, my questions are
1 How did you determine 1000 pips range..Assuming it is a classical range for the past 10 years,between the high and low, I can understand that concept
2 You say divide that into 2 500 pips range. I assume you are saying that, because volatility year to tear may differ and therefore a 500 pi range is good number to work with.
3...Ignored
Attached Image(s) (click to enlarge)