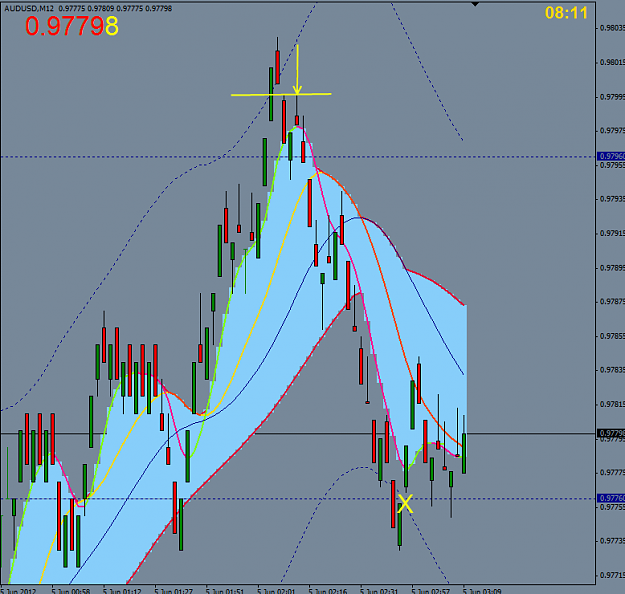
DislikedAs attached. So I wouldn't necessarily enter at candle close - rather, I tend to take trades off levels, and the MAs can serve as levels too.
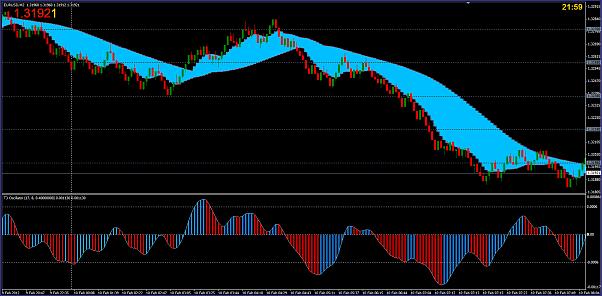
And I am not entirely comfortable with your chart settings. Seems like a 6 pip RB chart, it's another market, and it looks like I would tweak the MA1 in the cloud a bit, to 6 perhaps.Ignored
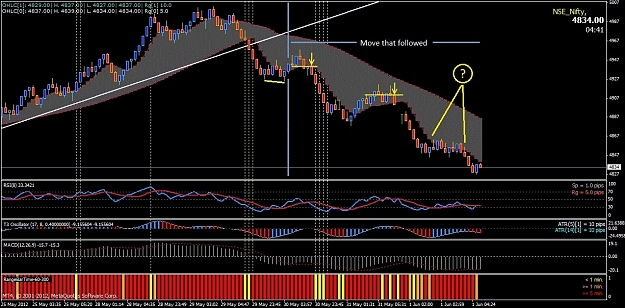
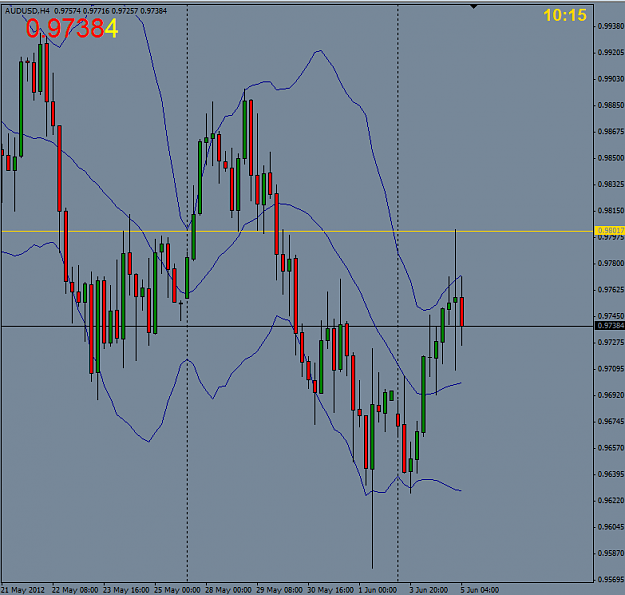
this is an index chart.
index has been ranging between 4700 and 5300 points.
the daily atr5 and atr14 are both ranging between 75 and 125 for over a year.
the bar range you see in the chart is 10 points.
given this input, would you recommend a different range for the bars?
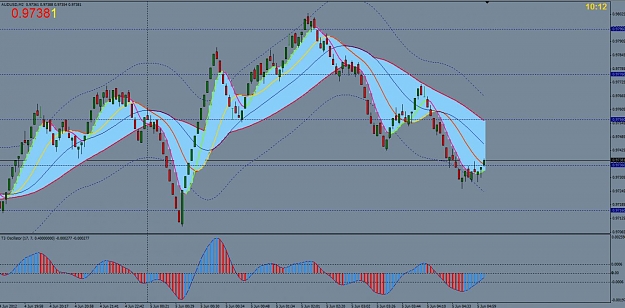
in the previously attached chart, MAPeriod1 value for the cloud was retained at the default 8.
I have changed that to 6 now; similarly for the T3 oscillator.
the chart is re-attached with these changes.
do you find this ok?
2 questions come to mind re. your suggested entries:
re. 1st entry
is the hammer immediately preceding the entry bar not dissuasive to the entry?
re. 2nd entry
why not an earlier entry after the 1st shooting star. it would still have been off the same level...
thanks a lot.
Attached Image (click to enlarge)