Hi
Firstly I have only been studying this thread over the weekend and appreciate that I have got a lot of reading and demoing ahead of me. I am more than happy to put in the neccessary time and effort but before doing so would like someone to cast their eye over the attached chart please.
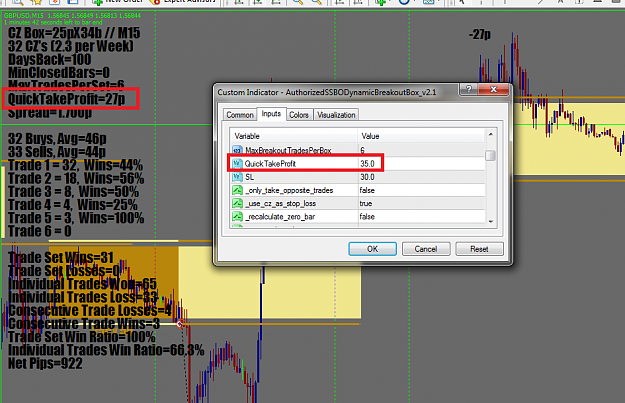
I have been playing around with different settings in the SSBO indicator and have noticed something which does not make sense to me. Again if it is glarringly obvious then I will gladly take any flak that comes my way and go straight to pre school without further notice!
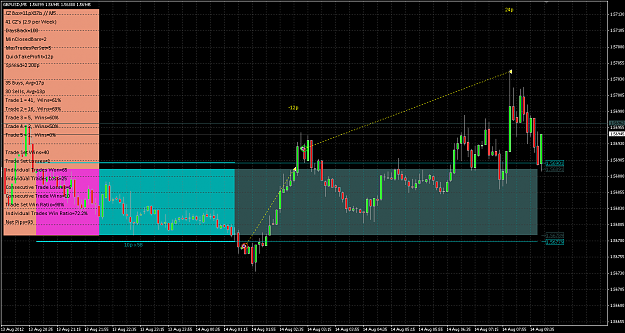
It is a 15m GBP/JPY chart, looking back a couple of days you will see that a "buy" trade was triggered. Unfortunatly the price retraced against us and we were stopped out at the opposite side of the CZ for -25p. I would have expected the second "sell" trade to have triggered 2 bars later (at the bottom of the big white down candle)? However the indicator is showing a winning "sell" trade for 51p which was taken at the top of the CZ AND the top of the candle that we just got stopped out on? How is this possible or am I just being stupid?
Please accept my apologies if this is conceived as a noob question but, I really would like some confirmation that it is me or the indicator giving false information before investing a lot of time and energy in what appears to be a very interesting concept.
Thank you in advance.
Kevin.
Firstly I have only been studying this thread over the weekend and appreciate that I have got a lot of reading and demoing ahead of me. I am more than happy to put in the neccessary time and effort but before doing so would like someone to cast their eye over the attached chart please.
I have been playing around with different settings in the SSBO indicator and have noticed something which does not make sense to me. Again if it is glarringly obvious then I will gladly take any flak that comes my way and go straight to pre school without further notice!
It is a 15m GBP/JPY chart, looking back a couple of days you will see that a "buy" trade was triggered. Unfortunatly the price retraced against us and we were stopped out at the opposite side of the CZ for -25p. I would have expected the second "sell" trade to have triggered 2 bars later (at the bottom of the big white down candle)? However the indicator is showing a winning "sell" trade for 51p which was taken at the top of the CZ AND the top of the candle that we just got stopped out on? How is this possible or am I just being stupid?
Please accept my apologies if this is conceived as a noob question but, I really would like some confirmation that it is me or the indicator giving false information before investing a lot of time and energy in what appears to be a very interesting concept.
Thank you in advance.
Kevin.