The Tick Volume Indicator (TVI) was invented by William Blau and is described in his 1996 book Momentum, Direction and Divergence, thus:
I have no idea what any of this means, but have opened the indicator in MQL Editor and find it is the shortest piece of coding for an indicator (and therefore apparently the simplest) I have ever seen. This is not to say I've seen many. The inclusive explanation can be found here: Google Books, in Chapter 4.
I first ran accross the TVI in Lou G's thread ALF/TVI, simple, effective daytrading, but believe it's standard equipment under Custom Indicators in most MT4 platforms.
"Let us devise an indicator for daytrading that separates the upticks and downticks in each price bar interval. [...] Let us define DEMA (upticks,r,s) as the double (EMA) smoothing of the upticks. By this we first perform an exponential moving average of the upticks for the r-bars; the result of the first smoothing is then exponentially smoothed for s-bars. Similarly, we define DEMA (downticks,r,s) as the double (EMA) smoothing of downticks.
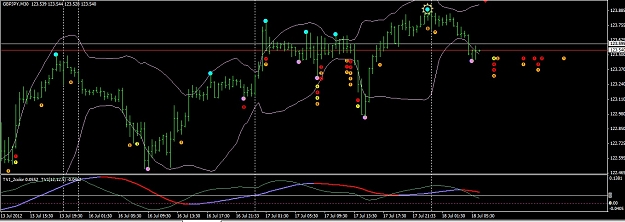
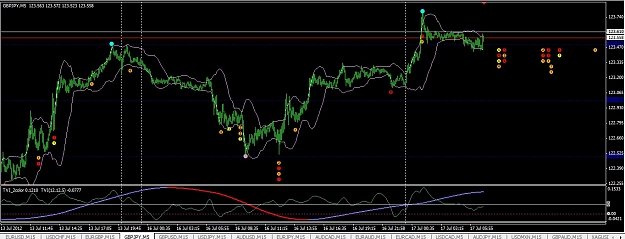
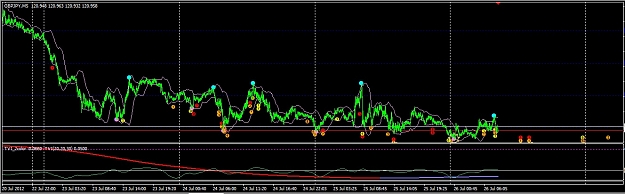
We then define the Tick Volume Indicator (TVI) as:
DEMA (upticks,r,s) - DEMA (downticks,r,s)
DEMA (upticks,r,s) + DEMA (downticks,r,s)
I have no idea what any of this means, but have opened the indicator in MQL Editor and find it is the shortest piece of coding for an indicator (and therefore apparently the simplest) I have ever seen. This is not to say I've seen many. The inclusive explanation can be found here: Google Books, in Chapter 4.
I first ran accross the TVI in Lou G's thread ALF/TVI, simple, effective daytrading, but believe it's standard equipment under Custom Indicators in most MT4 platforms.