DislikedI re-read your first post, and I think I misunderstood you. Sorry about that. Here's what I do whenever I draw up a chart.
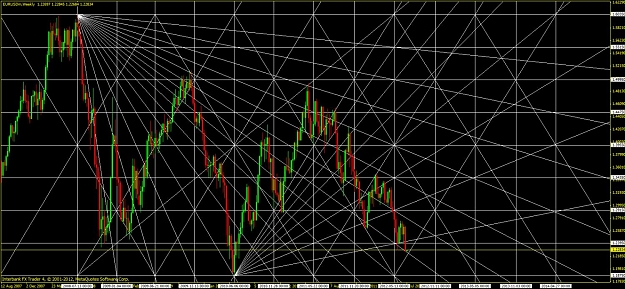
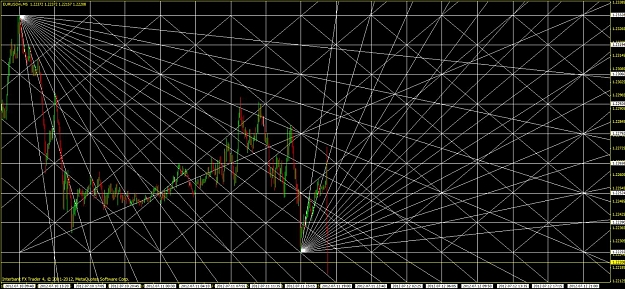
First I find a swing high and swing low. Then I'll put a horizontal line on the high and another one on the low. Then I'll go into the trendline properties and put the actual price in there, instead of just guessing with my eye.
Then I'll put a vertical line on the high date, and one on the low. So, now I just squared my time period that I'm using. After that, I'll put a big old X in the box. All my horizontal lines are...Ignored
Ah Im with you now FEP
cheers