Thanks. That was not confusing at all. I understood it 100%. As I was reading it, I was following the bid and ask lines on my chart so I could understand what you are saying.
Thanks for explaining.
Thanks for explaining.
DislikedOk here goes (it's quite hard to explain).
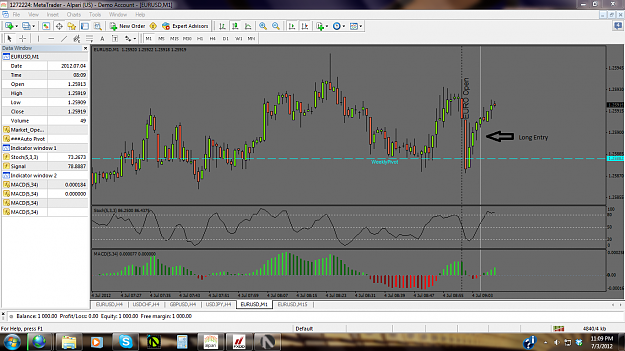
Basically it's to do with the way the candles are drawn on the chart. As you know there are two prices quoted, the bid and ask.
The candles highs, lows, opens and closes as shown on the chart are always drawn using the low price of the spread.
When you sell, then the sell line appears at the lowest price of the spread, however the actual price at that time is the higher price of the spread (hence why you are 'down' as soon as you place a trade).
If the SL was placed only 0.4 pips above the last...Ignored