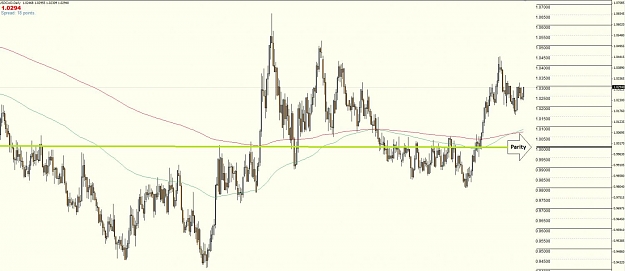
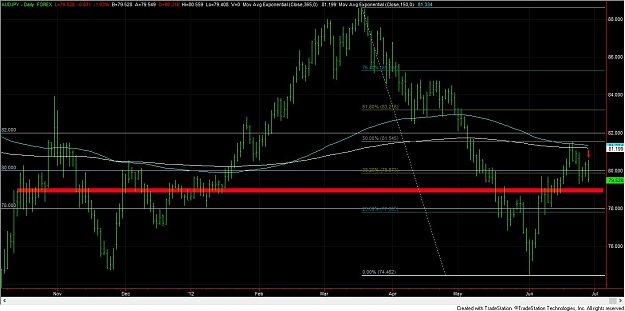
Dislikedanyone following the aussie? I need a more indebt analysis. Double high lower close just completed on the 8 hour chart, but there a small sorta pinbar that formed around the 25th on the 8 hour and daily charts.Ignored
 james16 Chart Thread
- #113,786
- Edited 8:14am Jun 28, 2012 8:03am | Edited 8:14am
- Joined May 2010 | Status: HCR-LCS SFP | 6,026 Posts
- #113,788
- Jun 28, 2012 8:44am Jun 28, 2012 8:44am
- | Joined Nov 2011 | Status: Trader | 1,078 Posts
Thoughts are things
- #113,794
- Jun 28, 2012 10:30am Jun 28, 2012 10:30am
- | Commercial User | Joined Aug 2006 | 12,004 Posts
- #113,796
- Jun 28, 2012 10:32am Jun 28, 2012 10:32am
- Joined Jun 2012 | Status: Signed In | 5,309 Posts
- #113,800
- Jun 28, 2012 11:45am Jun 28, 2012 11:45am
- Joined Oct 2010 | Status: full time beer drinker | 1,345 Posts