Ok, I understand now, thank you. However, these targets look awfully close to the entry and a decent s/l (on the other side of the LCS/HCR) will be multiple times the first target. Also I do see at the example that you are trading into areas with very little "space". Am I correct to say that this is more of a scalping method around LCS/HCR levels?
Ignored
If I may answer on Behalf of JARROO ,
the example shows trade being take into traffic but that's just an example ... It does not mean that we are suppose to take a trade into traffic .. We are also suppose to trade into space using this method but taking trade into traffic is not TABOO if you know how to manage ..
No , this is not a scalping method . The levels looks close but actually , they help us take most of the profit from our trade as possible if we trail our stops with these levels , and then , if price takes us out by reversing on us , then we will have another chance of entry again when the PBT&CA the level at which price reverse on us ... Entry chances are not rare but plenty , so do not be afraid of close targets ... It is actually a Plus point ...
I would be very careful as it has only 20-30 pips free space. Also although 0.80 is a VBRN it has not much power in it for me. Little action in the past. Especially comparatively with the area above (0.8070).
Ignored
I tend to move to BE as soon as I can , so , I am most of the time not afraid what the price do to me ... Thank you for the advice ... Always welcomed ...
One of the big downsides of waiting price action confirmation. It can mean you arrive late to the party.
The BEOB was pretty big so you have to hope for a retrace back towards 0.8. There's no guarantee that will happen.
Best plan here would have been a touch trade at 0.8 with a small stop. Or played the retrace back to 0.8 on the H4.
Ignored
Brother , you do not have to wait a retrace way back to 0.8000 which I doubt will happen ... If it does , good for you ... See my recent post about it ... I would recommend , not suggest , you do the same ... On your own risk ....
Sir If I may chime in:
- You should not always expect to make back to back or 2 consecutive trades, specially in a higher timeframe like daily.
it CAN happen, but at least u have to be realistic.
- more or less, we can say this is a continuation trade (this was not a swing low buy trade). and as such it is much trickier. u have to be prepared to run into potential PPZs
- price does not move in 1 direction for a very long time. there are always up & down moves along the way.
for nzdchf, it has been in a good upmove since 0.70/0.71 area. always...
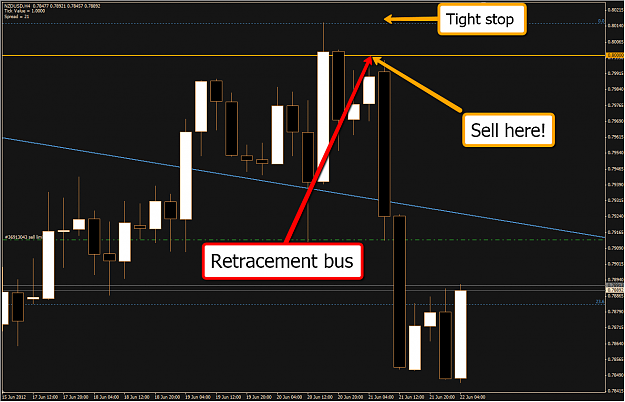
I would recommend , Do not take this trade ... It may work out no doubt , but 8/10 times , it will fail ... Its super tiny pin bar ... Plus you are on a lower time frame ... Plus almost no confluence , plus you are running straight into BRN ... Sincere advice ...
the example shows trade being take into traffic but that's just an example ... It does not mean that we are suppose to take a trade into traffic .. We are also suppose to trade into space using this method but taking trade into traffic is not TABOO if you know how to manage ..
No , this is not a scalping method . The levels looks close but actually , they help us take most of the profit from our trade as possible if we trail our stops with these levels , and then , if price takes us out by reversing on...
Ignored
Ok, thank you Chanya. So trailing very close and if momentum is strong we want get stopped out. If we get stopped we can reenter at the former s/l right? roughly how many pips above target you move s/l to target?
Is there a place where I can read about Jarroos method?
Brother , you do not have to wait a retrace way back to 0.8000 which I doubt will happen ... If it does , good for you ... See my recent post about it ... I would recommend , not suggest , you do the same ... On your own risk ....
Ignored
Oh I don't think it will either. I meant if I was watching the H4 chart yesterday I could have got in on the retracement back to 0.8.
Although no price action, I think the small risk would have been worth it.
sweet!
I'll save up & u should invite me. I think I need a visa to get there.
she can pose as my fiance jjust so i can get a tour or permanent visa
I'm from the Philippines. Aussie land is just a few hours away, you know
Ignored
Great! Sounds like a plan We can get a nice big yacht and bypass any need for customs so you can walk in VIP style. Besides, we can trade on the way at sea as well LOL!!!!!!!!!!! I don't know whether it's true or not but I heard that all the income that you earn whilst travelling on international waters are all tax free so we can arrive at circular quay the proper way, or do some roundtrips around the bahamas for a bit first
Ok, thank you Chanya. So trailing very close and if momentum is strong we want get stopped out. If we get stopped we can reenter at the former s/l right? roughly how many pips above target you move s/l to target?
Is there a place where I can read about Jarroos method?
Ignored
I suggest u to click on Jaroo's name and write the word HCR in the search, then read all the posts u'll find.
Ok, thank you Chanya. So trailing very close and if momentum is strong we want get stopped out. If we get stopped we can reenter at the former s/l right? roughly how many pips above target you move s/l to target?
Is there a place where I can read about Jarroos method?
Ignored
No , no no no .. You have got it all wrong ... Its got almost nothing to do with momentum or reentering at stop loss level ....
This thread is the only place where you can learn about JARROO's method ... If you want , you can contact him and he will himself teach you , He is a very nice guy . or visit his profile and view his charts ... And if you want , I can too as I myself have learned from him ... Contact me through PM and I will do what I can ...
Regards
Yes, it was a nice little setup with the potenial to be a big one . .but Price hit its targets and that is really all we want a setup like this to do . .
Ignored
Indeed it did and very well too.
It also bounced where we would expect it may.
Ever had TO THE PIP experience ??? I just did today ...
EUR USD is just hit and run for me .. because price also broke through and closed below a weekly level and retest of it is due ... Will enter short there again ..