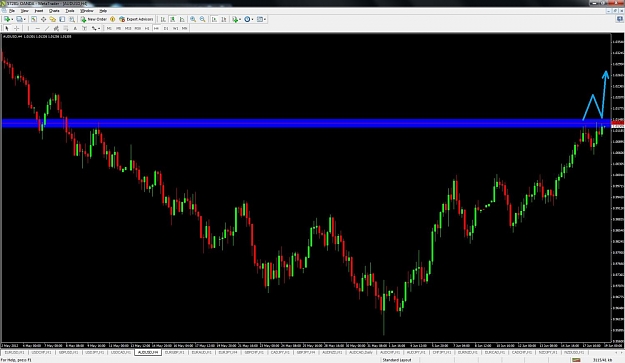
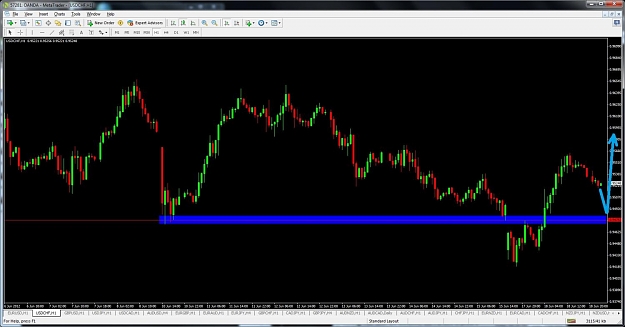
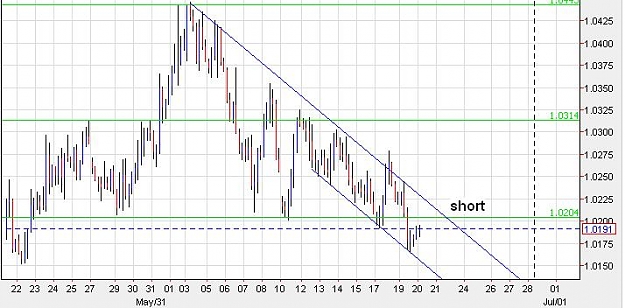
DislikedChart 1 (Daily eurusd) - The Daily chart shows a possible bounce south.
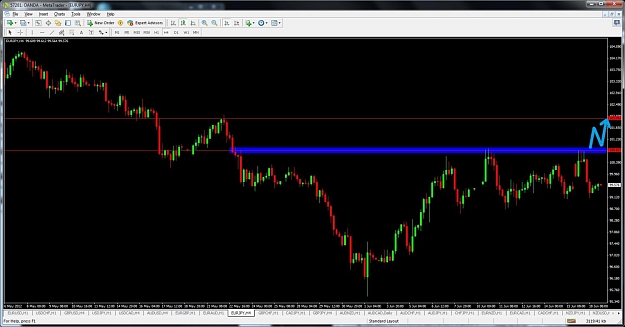
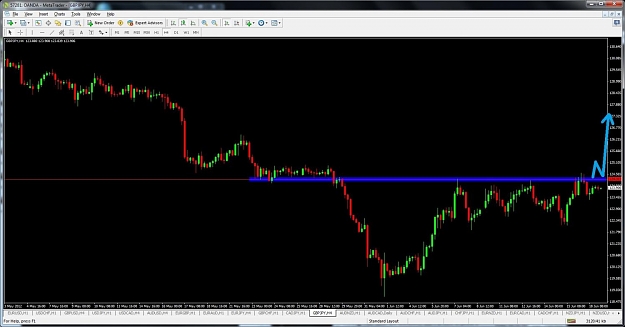
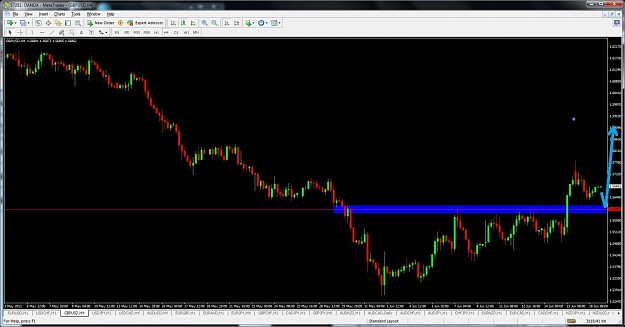
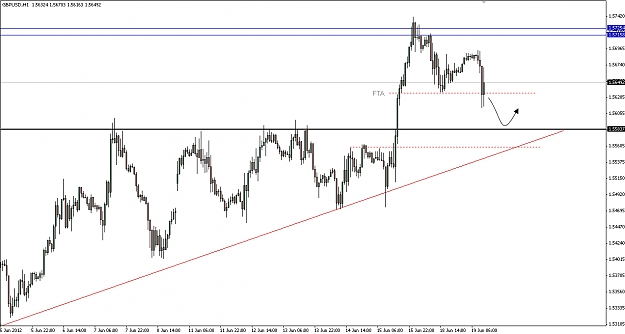
Chart 2 (Hourly eurusd) - This daily level, the green line plotted on the hourly chart shows that the hourly bars have consolidated bellow this daily level, broken through and now are bouncing at this level.
My question: Is it wise to trade long on the hourly chart when the daily chart is showing a long term shorting opportunity (a possible bounce south at this level)?
... or ...
Should I wait for a possible short opportunity on the hourly chart?
Yes this is for educational...Ignored