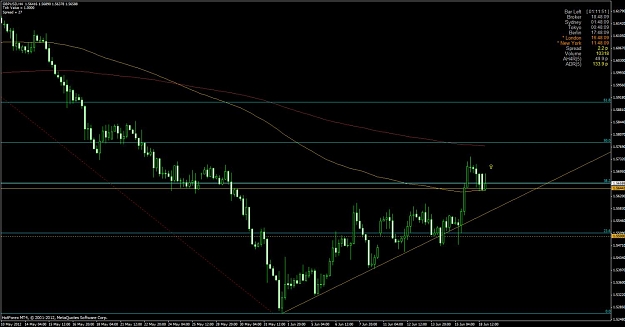
I am still long from the daily BUOB I pointed out last week, bought on a retrace of it. I feel like it's finding support right now between 1.56 and 1.565 after breaking above the multiple bar highs on Friday.
Price is beautiful. A repetitive method is a competitive method.
In support of ricosta, the pair, despite a nice BEOB has a trendline supporting it and traffic to the left. Probably wouldn't move much after breaking the bar and might be subject to strong retracement upwards.
Hey , it was you who said to me last night to watch this cross remember ??? I was seeing nothing specific or eye catching on it , neither am I now ... I am just making assumptions what you meant when you said this to me
I never saw anyone mention the giant daily pitbull BUOB on Natural gas last week. Does Mike or anyone else have any thoughts they wanted to share about it? I liked it's size, location, and the fact that it engulfed a range of bars preceding it. My FTA would of been around 2.70-2.75 had I played it. It also translated into a BUOB on the weekly chart.
Just trying to strike up some conversation with you friendly folks. :-)
Price is beautiful. A repetitive method is a competitive method.
I never saw anyone mention the giant daily pitbull BUOB on Natural gas last week. Does Mike or anyone else have any thoughts they wanted to share about it? I liked it's size, location, and the fact that it engulfed a range of bars preceding it. My FTA would of been around 2.70-2.75 had I played it. It also translated into a BUOB on the weekly chart.
Just trying to strike up some conversation with you friendly folks. :-)
Ignored
huge bar minor swing point. Not a ton of confluence. These bars usually get us to our FTA though which is the first blue box, with the major area being the massive resistance at the swing high. I like big bars though
huge bar minor swing point. Not a ton of confluence. These bars usually get us to our FTA though which is the first blue box, with the major area being the massive resistance at the swing high. I like big bars though
Best
Mike
Ignored
Thanks Mike, your awesome
Price is beautiful. A repetitive method is a competitive method.
I am at the point where I actually don't mark them up except for maybe a couple lines here and there(a pattern, TL, and my BRNs) all the other things like PPZ I can just see. I only mark them up for teaching purposes. I do think it's important to mark areas when starting out, but the way to prevent the clutter is mark the MAJOR areas of confluence. That way your charts don't look like a laser show.
Another trick is to stick to analyzing the same timeframe. So often I see people mark up a monthly, weekly , daily ppz, confluence and...
Ignored
I'm going to chime in on this if you don't mind.
I like analyzing the pairs on Sunday and just placing lines at vital areas for the next week. I look at weekly and daily, then just plot a couple spots on the pairs where something sticks out most.
A good example right now on GBP/USD I have a horizontal line placed @ 1.5600 because I am anticipating price to find good support there.
sweet. Appreciate the chart.
Is there a thread like this over at j16group?
Ignored
hey Fox
We have lots of that stuff, depending on instructor. Myself I do my trading in my section and send out emails. That was an email I sent out but I post them from time to time here for everyone as well to help out
I like analyzing the pairs on Sunday and just placing lines at vital areas for the next week. I look at weekly and daily, then just plot a couple spots on the pairs where something sticks out most.
A good example right now on GBP/USD I have a horizontal line placed @ 1.5600 because I am anticipating price to find good support there.
We have lots of that stuff, depending on instructor. Myself I do my trading in my section and send out emails. That was an email I sent out but I post them from time to time here for everyone as well to help out
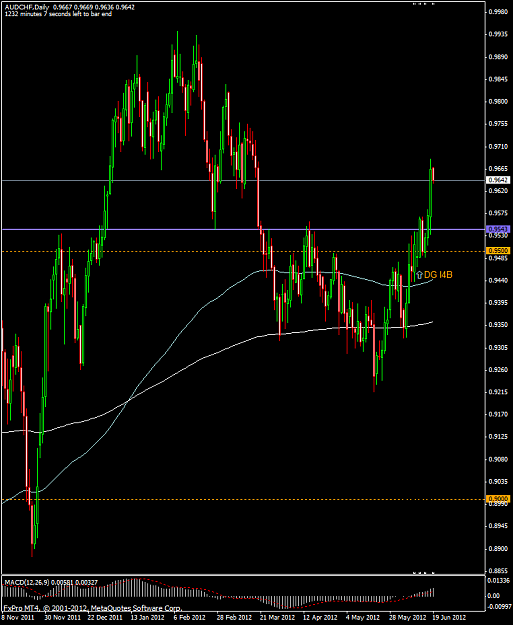
Looks like this was potentially a nice Dan Gilbert I4B special :-)
Ignored
Update on this "DG-I4B" :-)
BTW Dan I was going through some TED talks over the weekend, are you actually Dan Gilbert? I enjoyed the talk, gotta practice me some of that synthetic happiness.
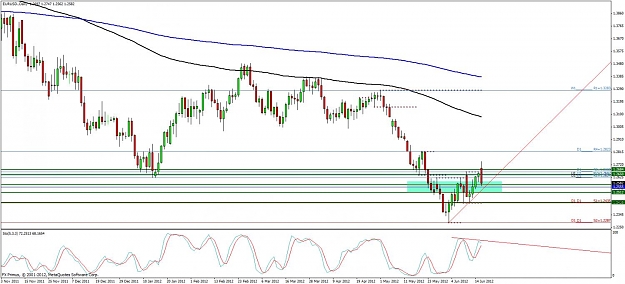
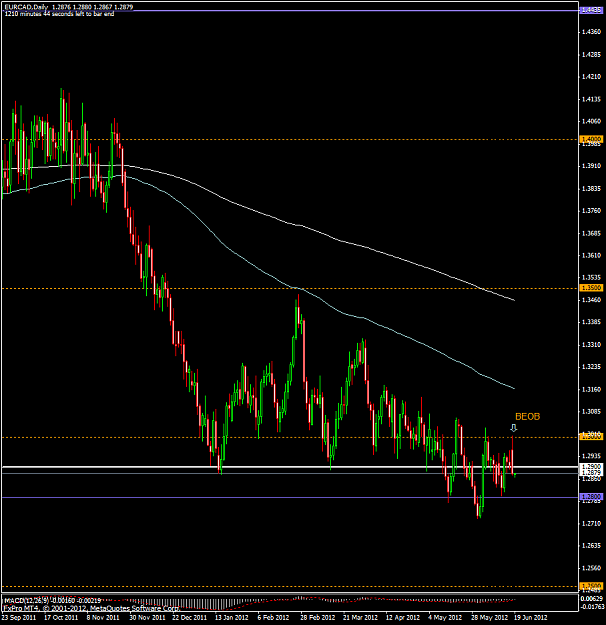
Anybody looking at or considering the EURCAD BEOB?
Pros: Interesting location, BRN, TL, engulfing two days worth of PA preceding it. Trend? Failed attempt at 1.30?
Cons: Average size, traffic, not located a major swing point high
Attached Image (click to enlarge)
Price is beautiful. A repetitive method is a competitive method.