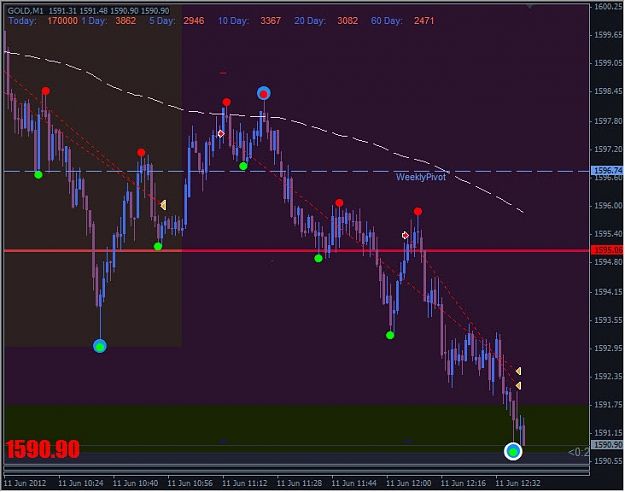
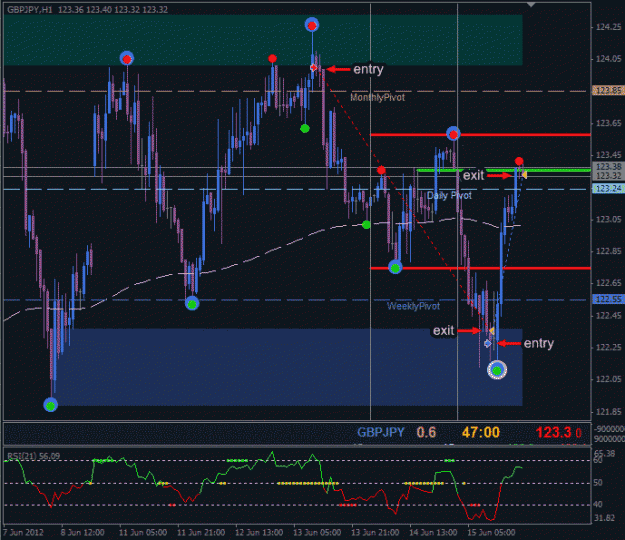
i have to admit it was left on accidentally.. was busy talking and forgot all about that it was friday and market close hours.. well, i'm not complaining...
i have to admit it was left on accidentally.. was busy talking and forgot all about that it was friday and market close hours.. well, i'm not complaining...
A nice 'mistake' to make. Nice compression into that level I took it be closed it after a few pips. Friday was tediously slow and Eurusd only seemed to get moving after the London close oddly enough.
Joined Aug 2009
|
Status: Reading the TAPE
|2,389 Posts
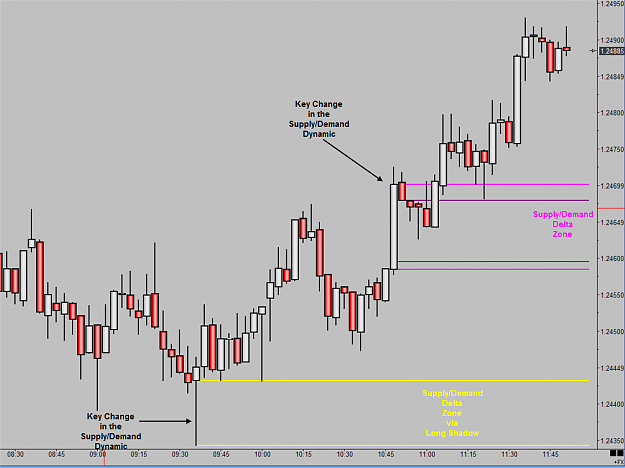
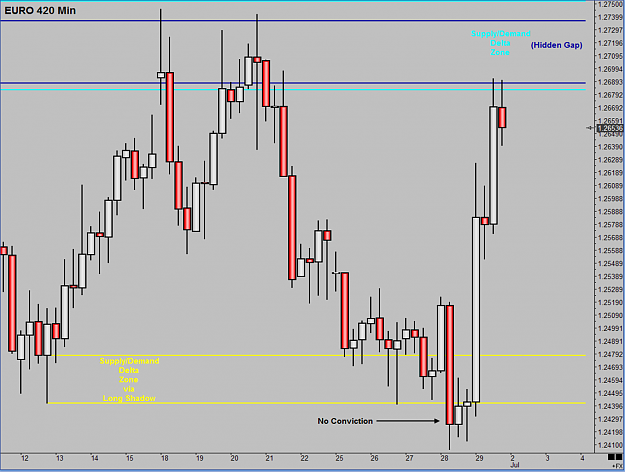
The Life of a Supply/Demand Zone
I was talking with a trader friend of mine and we got onto the subject of the life of a Supply/Demand Zone.
I first noted that my Supply/Demand Delta Zones are not technically the same as Supply/Demand Zones a la Sam S. They do share many things in common and I believe the concept of the life of a zone is one of those things.
Before getting into the similarities, I should mention a key difference. Many traders on this and the other S/D threads mistakenly, in my opinion, believe S/D Zones are the same thing as Support and Resistance areas. This is in fact not the case. While S/D zones share some attributes of S/R areas, there is a major difference. Unlike S/R areas, Supply/Demand Zones do not reverse polarity. Reverse polarity refers to a support area becoming a resistance area or a resistance area becoming a support area.
Think about it. If a Demand Zone is created by a rally base rally, why would a Supply zone be created if price went thru that area? Supply Zones created by drop base drops or rally base drop patterns. The simply act of "ignoring" a Demand Zone does not mean that area must actually be a Supply Zone.
But let's put that aside for the moment and ask this question. If a Supply/Demand Zone can reverse polarity when would you ever take it off your chart? That is to say, once you identify a Supply/Demand Zone, why would you ever take it off your chart if simply continually reverses polarity? Well, the answer is you really shouldn't. Which cause a real problem because over time your entire chart would be nothing but zones. Therefore, just from a practical standpoint, we need a way to keep the chart clean by taking off some zones from time to time.
At this point it may good to think about what Sam has said himself. He has said that the first time price reenters a zone is the time when the odds are the highest that price will react to the zone. Sam goes as far as to say he would place a limit order ahead of the first revisit to a zone but not the second or third time. Well, if one is only going to take a trade after the first revisit, shouldn't the zone be taken off the chart after that? Notice this revisited does not mean price has to react to the zone. It can straight thru. Either instance represents the first time back into the zone.
One reason I favor looking for entry set-up within a Zone is because it is clear that a strong zone can in fact have multiple revisits. That is to say, some of the strongest zones are defined by the fact that price has come back to them multiple times and the zones have "held". The irony is that the odds are in you favor with every subsequent revisit into an open zone when you use trade set-ups to enter. But when you rely on simple limit orders the odds go down with each subsequent revisit.
So the question is, "What do you mean by a zone has held?". When I refer to a zone as holding, I am referring to the fact that it remains open. Therefore what we need to determine is when a zone has closed. Price is the key. We do not need to look at any element of time. We can talk about a zone having a "shelf life" but there really is no time element involved. Only the element of Price. What specifically about price do we want to see? In a word, conviction.
Conviction is the key price concept that determines when a zone closes. For me, A Supply/Demand Zone which is acting as Demand closes when there is a full dark (open>close) candle body below the zone. Technically you would need a full white (open<close) body above the zone, price action thru the zone and then a full dark (open>close) body below the zone for a zone to close. The opposite is true for a Supply/Demand Delta Zone acting as Supply. Conviction would mean a full white (open<close) body above the zone. If your definition of a Doji allows for the open and the close to be slightly off, thus causing a small dark or white body, they do not count. The definition of a Doji is indecision. It cannot be both indecision and conviction all at once.
There are a couple of exceptions but I will leave them for another post.
Take a look at the charts below.
Notice that these two Supply/Demand Zones acting as Demand both have price action below them but neither one actually has price action that shows conviction. Again, for the haters, no trades are being shown or implied. In fact, I would not have seen a trade set-up in real time nor do I see one in hindsight. What I do see are two zones that do not meet a predetermined and constantly applied definition of conviction and therefore remain open.
Attached Image(s) (click to enlarge)
Without VSA, you're playing checkers while the Smart Money plays chess.
Joined Aug 2009
|
Status: Reading the TAPE
|2,389 Posts
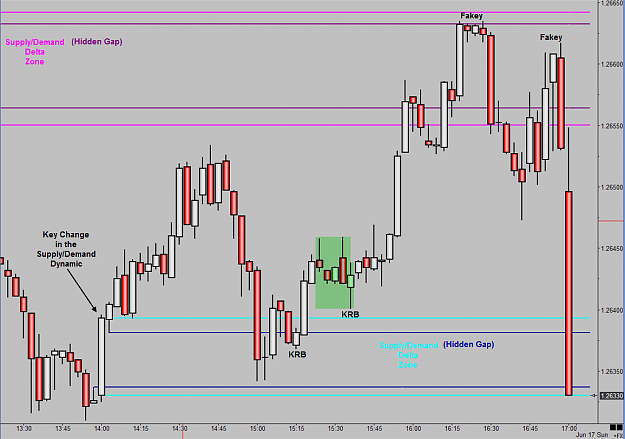
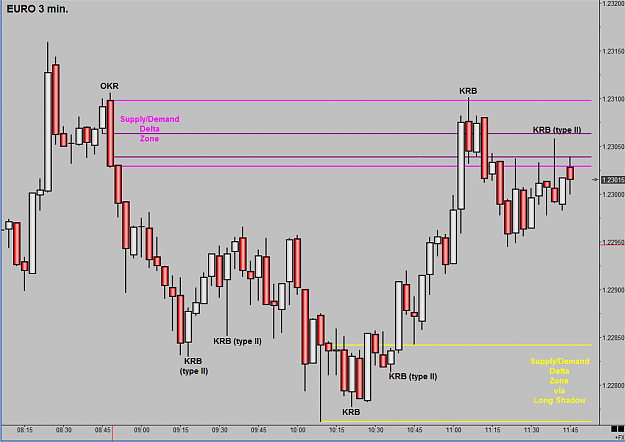
Just wanted to answer a PM that I got. I still have not figured out how to send a screen shot with a PM so I have to make a post.
The question was, what is a KRB? I have attached a screen shoot that shows at least on of my three (3) types of KRBs. KRB standing for Key Reversal Bar. On a side note, these definitions were originally applied to bar charts. Hence the term Bar and not interval nor candle.
Again, the point here is to answer a question about a definition. I am not showing a signal in hindsight....I do however, need the bar to print to show the definition of the bar..
KRB:
Obviously there is a bullish KRB and a bearish KRB. The chart below has both types.
The definition of a bullish KRB would be:
1. An interval that opens lower than the previous interval's close.
2. Makes an lower low than the previous two intervals.
3. Closes higher than the previous interval's close.
4. Closes higher than its own open. Therefore for candle users it is a white (open<close) candle.
The definition of a bearish KRB would be the opposite.
This is the basic type also referred to as a KRB (type I). This is my personal
favorite type.
KRB (type II):
The definition of a bullish KRB (type II) would be:
1. An interval that opens higher than the previous intervals close/
2. Makes a lower low than the previous two intervals.
3. Closes higher than the previous interval's close
4. Closes higher than its own open. Therefore for candle users it is a white (open<close) candle.
The difference between type I and type II is the open.
The definition of a bearish KRB (type II) would be the opposite.
OKR:
The definition of a bullish Outside Key Reversal (OKR) or OKRB would be:
1. An interval that makes a low lower than the previous two intervals.
2. Makes a high higher than the previous interval.
3. Closes higher than the previous interval's close and the previous interval's high.
4. Closes higher than its own open. Therefore for candle users it is a white (open<close) candle.
Here the open in relation to the previous close does not matter. What matters is that it is making a higher high and a lower low. Which is the definition of an outside bar.
Again, these are just bar definitions and not trade signals. They can be trade signals if one wants. Or one may want them to be part of a larger signal pattern. And still another may want them to both be part of a larger signal pattern and appear in the right place........
Attached Image (click to enlarge)
Without VSA, you're playing checkers while the Smart Money plays chess.
I was talking with a trader friend of mine and we got onto the subject of the life of a Supply/Demand Zone.
I first noted that my Supply/Demand Delta Zones are not technically the same as Supply/Demand Zones a la Sam S. They do share many things in common and I believe the concept of the life of a zone is one of those things.
Before getting into the similarities, I should mention a key difference. Many traders on this and the other S/D threads mistakenly, in my opinion, believe S/D Zones are the same...
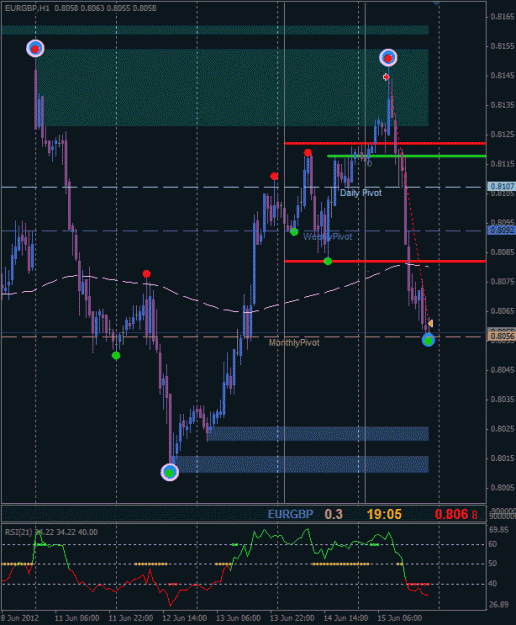
Now you can see on the weekly why I was wanting to short with a tl retest as a confluence and I used the daily to go short using a confirmation trade by using the engulfing created last week. I placed the SL there last night before the release of the AUD employment data in case it was good and price popped higher into the supply zone capped at 1.0472. I will also move the SL lower to lock in more profit before CNY data.
As you can see that there are engulfing patterns in both directions on the weekly and daily, so caution prevails and profit needs to be taken. Until we break parity, this pair is still bullish in the short-term, characterised by the higher lows and higher highs in the immediate trend.
However, with a dovish RBA and the possible lowering of interest rates again this year and the so called China hard landing, this has potential to go further down, although we need a convincing break of 0.9650 which is providing good support.
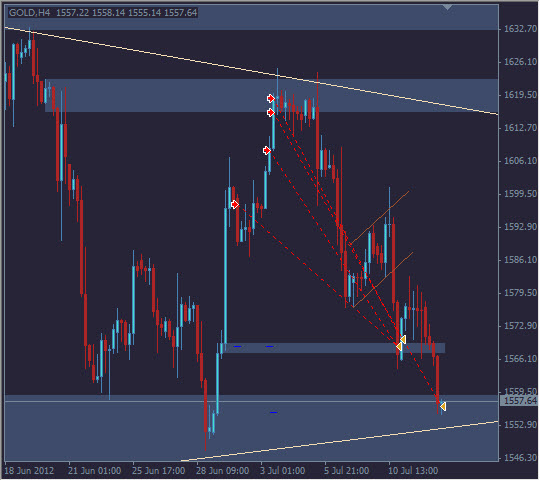
Enough of the trade and why I took it, but the point I am trying to make is that SS definition of a good zone is characterised by an engulfing as clearly sellers outnumber buyers (supply) or buyers outnumber sellers (demand) and therefore when price comes back to revisit, sellers (supply) will come in. Does that mean all engulfing patterns work... no. The higher the timeframe, the more reliable, but fundamentals can override technicals and then they will fail. (Look at the EU daily chart for a failed example... 28/6/12 and 29/6/12).
What is also important is that you must take HH, HL, LH and LL into your analysis to keep you on the right side of a trade, a key differentiator for finding zones that will work.
Anyway, enough of me... time to crawl back from where I came from and focus on my trading. See you in a few months no doubt.