DislikedGents, are you up to discuss Indicators a bit? What are you using if any?
I am using the PositionSizeCalculator to help me with my mm in % and the Tick-Value Indi which shows me the spread conveniently on the chart. Other than that I am using the alligator (EMA'S) with the default setting just to give me a broader picture of trend action. Tried MACD and others but I don't understand them and they confuse me.
Also I tried a few S/R Indicators before but didn't find one I really liked. Is there one which can be recommended? Could help with drawing...Ignored
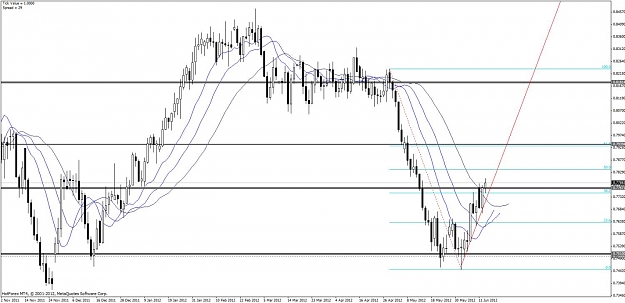
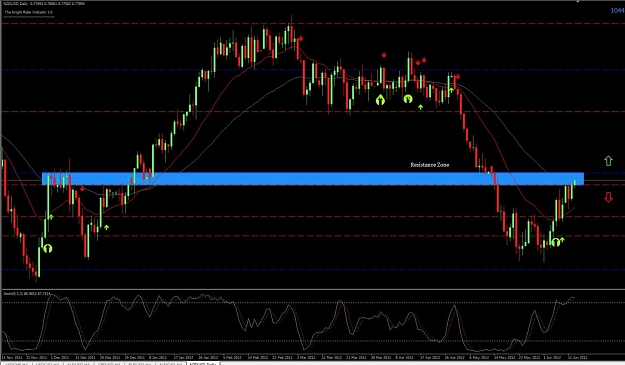
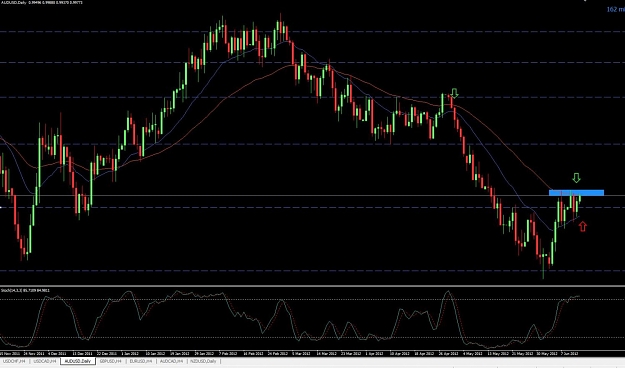
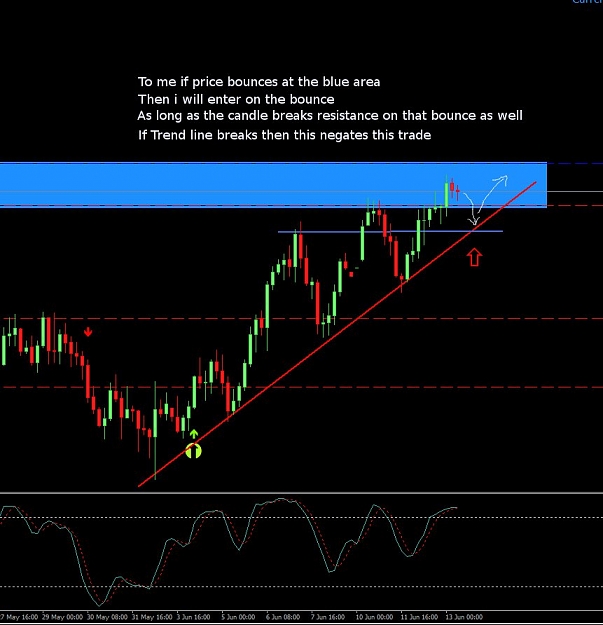
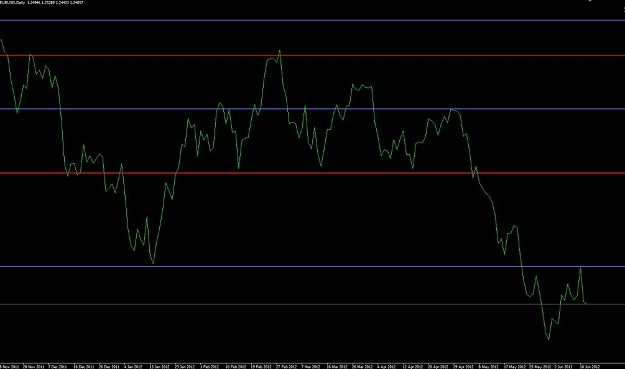
With the support and resistance lines i recommend drawing them yourself. To do it so go to the weekly chart first and find areas where it bounces multiple times. Then go to the daily and do the same.. You can also do so on the h4 as well, however the daily and weekly support and resistance lines are best i reckon. They are the ones i trade off..
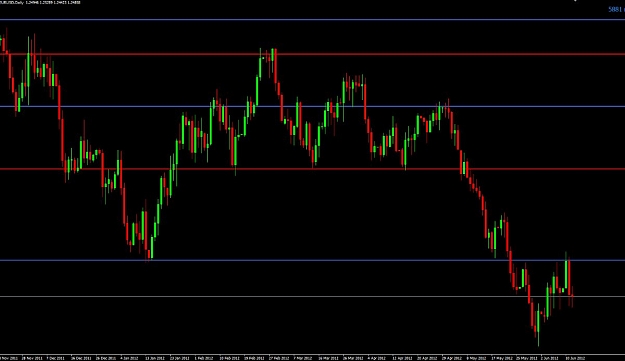
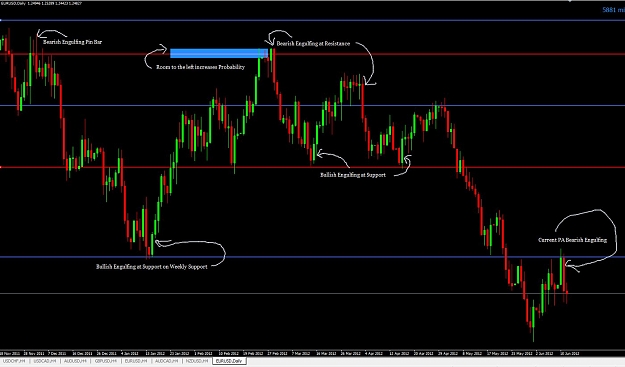
Below is some images of what i am saying and some trade ideas to match..
For extra confluence you can use PA, macd, stochastic or whatever you feel give you more of an edge when price gets to these areas..
The two different color lines are the to tell the difference between daily resistance lines and weekly..
Attached Image(s) (click to enlarge)
Attached Image