Very nice Buddy , Little advice , Remove the grid from your charts , it would make them alot easier to look at ... Instead , if you prefer , use grid indicator to show round numbers ....
Ignored
Chanya,
Can you provide more detail on what grid indicator is and how to get it.
My first 2 demo trades have taken off as I would have liked. Views would be appreciated on next steps. Here are my views:-
USDJPY
TP now moved behind the trendline locking in 70 pips profit. Price initially rejected off 77.3 (no surprise with all those bar highs). I see 76 being my ultimate target with this trade (a nice healthy 400 pips). If I can get a close below 77.3 I will move stop just behind that area and lock in more profit. Another option would be to trail the bars or the trendline down- would like some views.
CADJPY
Day 1 done...
Ignored
Hey Millions,
Great trades.
See my views below on how I would manage these trades.
USDJPY
Price is obviously going to find support at 78.00 with so many bar highs and it now has a lot of traffic to get through to reach your final target of 76.00. Price may now retrace and test 79.00 and I would leave your stop where it is currently knowing that price should struggle to break back above 79.00. Once you get a close below 78.00 I move your stop to just above this area as it should then act as resistance. At worst you are going to walk away with a 70 pip profit.
CADJPY
Todays bar closed below 76.00 which is a minor PPZ and price may struggle to close back above as price seems to have good momentum with 2 consecutive strong bearish bars. Personally I would move my stop to 10 pips above todays bar to allow for the retrace in case it happens. This would also lock in a guaranteed profit. Once price has a stronger close below 76.00 I would move the stop to just above this area to lock in further profit and have my TP @ 75.00.
These are just my own personal views and how I would manage these trades. Other members on this forum may manage these trades differently and it would be interesting to hear others views.
Getting your stop to BE at the FTA is crucial with any trade. James16 always reminds us that BE trades go in the win column and rightly so.
Well done and continued success with your demo trading but you are certainly on the right path.
I believe we'll get daily BUOB before todays closure on audchf...nice ppz + fib + monthly close + small monthly pin...FTA is 0.9500(round, high, 50% fib) lvl, so very close - i'm gonna be very careful...
Ignored
I got BUOB, but i don't really like closure, and h4 bearish pinbar...i 'm holding myself for now...
Chanya,
Can you provide more detail on what grid indicator is and how to get it.
M
Ignored
Here is the grid indicator . It simply plots all the round numbers on the chart automatically when applied . If you have four digit broker , set its value to 100 , or to 1000 if you have five digit broker ... Simple ...
Joined May 2010
|
Status: HCR-LCS SFP
|6,026 Posts
Mike, are you still holding this?
If so, I imagine you are watching this area of parity, very carefully.
Especially with this weekly Divergence kicking in.
Absolutely Pinbar . .I like these Weekly LCS levels too (in blue) . .but I like yours better because its on the Monthly and the Weekly TFs. .
Ignored
Yes Jim, I am also watching that weekly Gap open as a possible trigger.
I realized something, I can now look at the chart with the RN indicator horizontal lines and, use the deep SPs as triggers, and the Rns as targets or SL placement, without it confusing me, like it did before.
I think The trick is, keeping our eye on the swing points. Especially, when they line up with the RNs and multiple higher TFs.
Yes Jim, I am also watching that weekly Gap open as a possible trigger.
I realized something, I can now look at the chart with the RN indicator horizontal lines and, use the deep SPs as triggers, and the Rns as targets or SL placement, without it confusing me, like it did before.
I think The trick is, keeping our eye on the swing points. Especially, when they line up with the RNs.
Had my order set for this for a few days and it got filled today.
I took the trade as there is a strong down trend.
The lowest close resistence is 0.9894 means the stop is protected by the round number of 0.9900
In the words of jarroo it was bam and to the pip.
And using the hourly signature as protection against taking a full loss gives me real confidence in these trades.
FTA hit happy days.
Ignored
Hi Haircut,
Can I ask what the price is that shows on your chart I've got a price of 1600 for gold as the BRN you refer to but yours is .9900???.
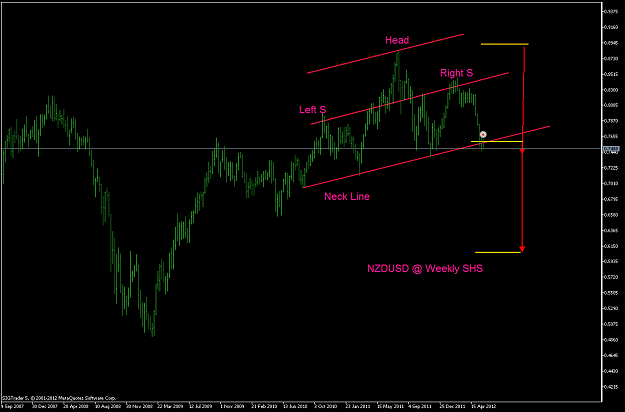
NZDUSD Weekly TF - SHS formation, break out the neck line after 2nd week consolidation PA look like the valid SELL signal to continue going down (long term target base on weekly time frame) NZDUSD Bearish camp ..