New voice message: Why are you calling me? If I need you, I'll call you!
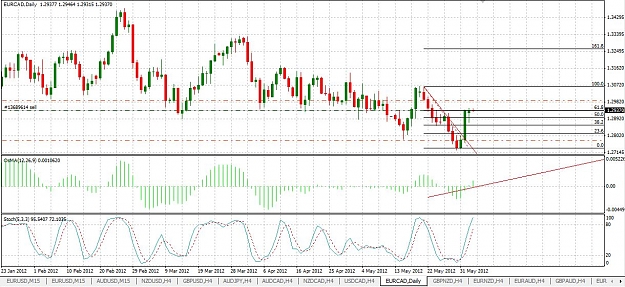
 EurCad Analysis and Trading Ideas
- #581
- May 30, 2012 6:03am May 30, 2012 6:03am
- Joined Jul 2007 | Status: Short on USD/MXN, Long on legs | 16,578 Posts
- #583
- Jun 3, 2012 5:53am Jun 3, 2012 5:53am
- Joined Apr 2011 | Status: Free Palestine.. | 1,567 Posts
If skills could be acquired by watching, every dog would be a butcher. Turk
- #584
- Jun 3, 2012 6:17am Jun 3, 2012 6:17am
- | Joined Dec 2011 | Status: Trader | 2,927 Posts
swing it!
- #586
- Jun 3, 2012 7:26am Jun 3, 2012 7:26am
- | Joined Dec 2011 | Status: Trader | 2,927 Posts
swing it!
- #588
- Jun 3, 2012 7:44am Jun 3, 2012 7:44am
- | Joined Dec 2011 | Status: Trader | 2,927 Posts
swing it!
- #589
- Jun 4, 2012 1:57am Jun 4, 2012 1:57am
- Joined Jul 2011 | Status: Heads is a buy. Tails is a sell. | 1,031 Posts
- #590
- Jun 4, 2012 5:16am Jun 4, 2012 5:16am
- | Joined Dec 2011 | Status: Trader | 2,927 Posts
swing it!
- #591
- Jun 4, 2012 1:45pm Jun 4, 2012 1:45pm
- Joined Jan 2012 | Status: Gone | 1,570 Posts
Defending Truth, Capitalism and the US Constitution
- #592
- Jun 7, 2012 1:29pm Jun 7, 2012 1:29pm
- Joined Jul 2007 | Status: Trader | 17,796 Posts
COT: The precious data ignored