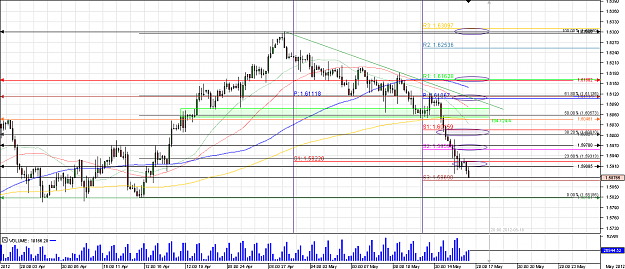
>> 5) Eur/Usd - 4 hours Chart - (15.05.2012)
Market Conditions:
Market Conditions:
- Major Downtrend from May 2011,
- Intermediate Downtrend from March 2012,
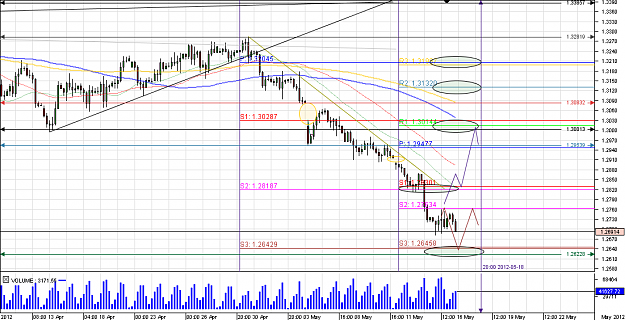
- Minor Downtrend from 1st of May 2012, 470 Pips Sell-Off
- Increasing Bearish Volume,
- 2 Breakout Continuation Gaps (1.308, 1.291)
- Bullish Probability Key Levels:
- 1.291 - the close from Friday and the continuation Gap from Monday opening,
- 1.295 - weekly Main Pivot Point and the Resistence from 6th of May, (1st Level Key Level),
- 1.300 - 1.303 area - confluence between the hystorical level and support from 16th of April and the Monthly S1 Pivot and the Weekly R1 Pivot, (2nd Level Key Level),
- 1.308 - the close from 4th of May which formed a Breakout Continuation Gap maybe future confluence with the 100 SMA,
- 1.313 - confluence between the Weekly R2 Pivot Point and the 200 SMA, (1st Level Key Level),
- 1.318 - 1.320 area - Important confluence between the Monthly Main Pivot, the Weekly R3 1Pivot Point and the Intermediate Downtrend Trendline, (2nd Level Key Level),
- Bearish Probability Key Levels:
- 1.285 - 1.282 area - confluence between the Weekly S1 Pivot and the Monthly S2 Pivot. (1st Level Key Level),
- 1.276 - Weekly S2 Pivot Point,
- 1.262 - 1.264 area - Important Demand area confluence between the Support from 15th of January, the Monthly S3 Pivot and the Weekly S3 Pivot Point.
Probability Charts:
Bullish and Bearish Clear Probabilities:http://www.dukascopy.com/imageserver...2/image495.jpg
Mixed Probabilities:
http://www.dukascopy.com/imageserver..._2/image73.jpg http://www.dukascopy.com/imageserver...2/image969.jpg
Thank You for your support,
Doctortyby