• Home
  • Forums
  • Trades
  • News
  • Calendar
  • Market
  • Brokers
  • Login
  • Join
  • User/Email: Password:
  • 9:18am
Menu
  • Forums
  • Trades
  • News
  • Calendar
  • Market
  • Brokers
  • Login
  • Join
  • 9:18am
Sister Sites
  • Metals Mine
  • Energy EXCH
  • Crypto Craft

Options

Bookmark Thread

First Page First Unread Last Page Last Post

Print Thread

Similar Threads

THV System Trades & Patterns Thread 856 replies

THV 4 system with SAH; My Trading Journal 163 replies

Bow's trading journal (THV, Hmaoui simple system) 4 replies

My Journal - Based on THV V3.0 by Cobraforex 30 replies

the vouchers - THV System 2 replies

  • Trading Systems
  • /
  • Reply to Thread
  • Subscribe
  • 7,800
Attachments: THV system, final edition
Exit Attachments
Tags: THV system, final edition
Cancel

THV system, final edition

  • Last Post
  •  
  • 1 11861187Page 118811891190 1295
  • 1 Page 1188 1295
  •  
  • Post #23,741
  • Quote
  • May 14, 2012 7:55am May 14, 2012 7:55am
  •  W.Pigeon
  • | Joined Aug 2011 | Status: Member | 32 Posts
Quote
Disliked
Come on what do you peeps do while waiting, I'm really curious.

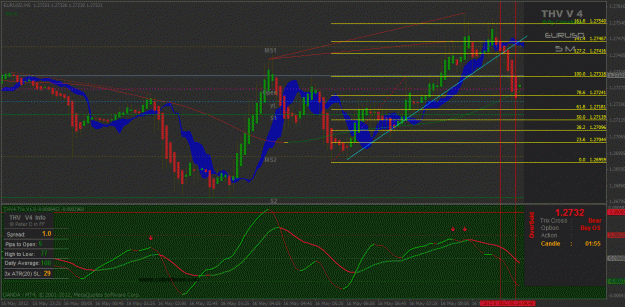
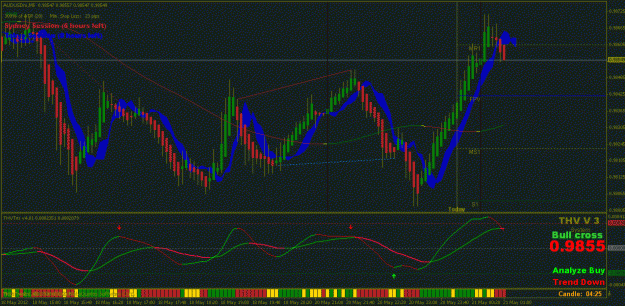
Heh, work on my studies! I have MetaTrading going in the background while I work. It alerts me to changes in the trend and then I give it a quick look to see if a trade is appropriate. Works quite well actually

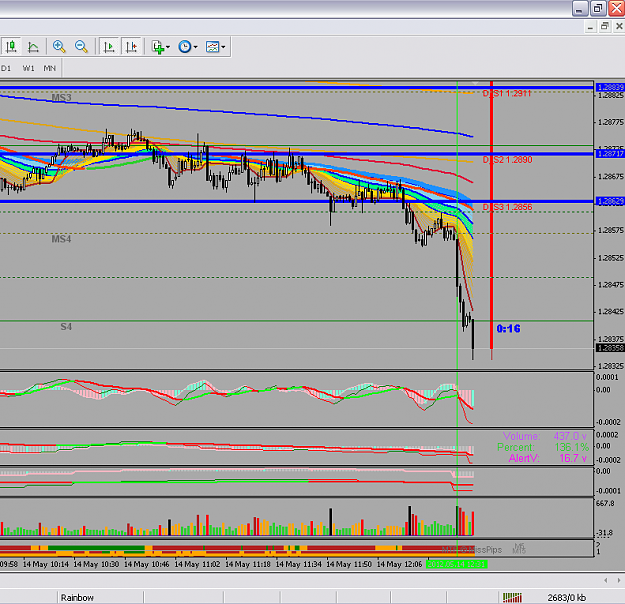
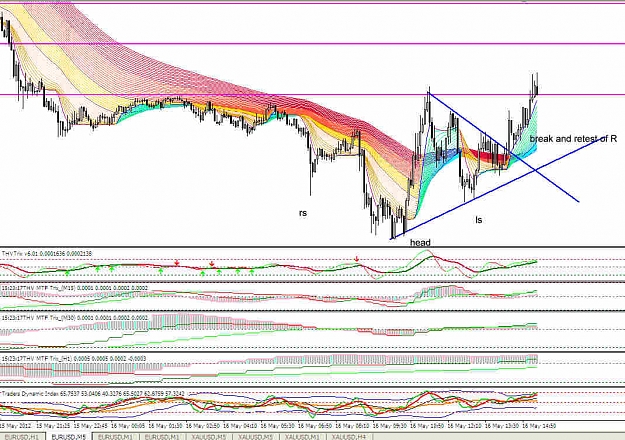
I've been finding it difficult to trade these last few week days. Bear in mind I'm using a conservative approach with the rainbow. Today I've got nothing as trades go... signals that I am getting are too close to Support and Resistance for my tastes
 
 
  • Post #23,742
  • Quote
  • May 14, 2012 8:44am May 14, 2012 8:44am
  •  W.Pigeon
  • | Joined Aug 2011 | Status: Member | 32 Posts
Quote
Disliked
Today I've got nothing as trades go...

Scratch that. This trade would have been acceptable. There was a weak bullish divergence on 5 min, however, the volumes for 1 min bearish were growing stronger over the last 30 minutes. Not a perfect setup, but good enough depending on confidence. Would have TP at S4 (7 pips).
Attached Image (click to enlarge)
Click to Enlarge

Name: Trade1.PNG
Size: 43 KB
 
 
  • Post #23,743
  • Quote
  • Edited 12:45pm May 14, 2012 11:51am | Edited 12:45pm
  •  MissPips
  • Joined Jul 2008 | Status: #welcomebackGator | 2,418 Posts
That was a good setup. It was a BRC(break,retest and continuation) with momentum, and it broke the low where there was divergence.

My experience with divergence is that the trix is problematic with divergences at certain times. When price is consolidating near the coral and the trix is flat near 0, it can show fake divergence. If you are trading divergence in the direction of the rainbow trend it's one thing because the odds are in your favor, but if trading against the main trend it's better to get confirmation that price has really diverged far enough that it wants to pull back some.

My rules are that I don't trade divergence against the trend unless it's at least a third price wave. Also for divergence against the trend I want to see the CCI and the TDI confirm it, and I want it to look pronounced . In the case of the CCI I want at least one of the waves to be over 200 and in the case of the TDI I want the RSI line (green line) one wave to be outside the blue bands and for the second wave inside. Having the trix outside it's overbought or oversold lines is also a plus. This is my way of verifying that it's not divergence inside consolidation that wants to expand in the direction of the trend when it's done, but real divergence where price is really too overextended and wants to return to the mean. Also I'd rather trade the second one in a row of two that are close together because the EURO has a nasty habit of stopping the first one out by a couple of pips above/below the high/low and then, having shaken out the weak hands, doing a nice reversal. If you get divergence against the trendinside consolidation near the coral (while the price is compressed near the spine of the rainbow) you can usually ignore it, especially if it breaks the high/low.

Attached Image (click to enlarge)
Click to Enlarge

Name: div.jpg
Size: 80 KB


The trick is to notice if the divergence is happening while the rainbow is compressed and trying to expand, or while it is overextended and trying to contract. I put that yellow/aqua stripe where it is in the 1 and 5m rainbows for a reason. If you look at what it is doing compared to the previous waves it will help you distinguish between expansion and compression. Notice how the yellow stripe looks in each of the waves that make up the fake divergence verses how it looks in each of the waves that make up the real divergence. In the fakeout, the yellow band is expanding in each wave as price goes lower and in the real deal the yellow band in the 1m rainbow is contracting with each wave even though price is going lower. Also in the real deal the edge of the waves themselves are getting higher as price goes lower, while in the fakeout the edge of the rainbow is going lower as price does.

Quoting W.Pigeon
Disliked
Scratch that. This trade would have been acceptable. There was a weak bullish divergence on 5 min, however, the volumes for 1 min bearish were growing stronger over the last 30 minutes. Not a perfect setup, but good enough depending on confidence. Would have TP at S4 (7 pips).
Ignored
Attached Image (click to enlarge)
Click to Enlarge

Name: div3.jpg
Size: 111 KB
 
 
  • Post #23,744
  • Quote
  • Edited 4:57am May 15, 2012 4:46am | Edited 4:57am
  •  W.Pigeon
  • | Joined Aug 2011 | Status: Member | 32 Posts
Quote
Disliked
The trick is to notice if the divergence is happening while the rainbow is compressed and trying to expand, or while it is overextended and trying to contract. I put that yellow/aqua stripe where it is in the 1 and 5m rainbows for a reason. If you look at what it is doing compared to the previous waves it will help you distinguish between expansion and compression. Notice how the yellow stripe looks in each of the waves that make up the fake divergence verses how it looks in each of the waves that make up the real divergence. In the fakeout, the...

Cheers Miss Pips! Yeah I'll take that on board, thanks. I've been wondering whether to use a separate graph for divergences recently, so I'll give the CCI a go and see how it turns out with relation to what you said. All in all, I've found the rainbow system to be the most helpful in relation to its contraction/expansion cycle. Its possibly one of the most helpful visual aids for trading in general for me.

I had another good setup today - shame I was asleep! I got a strong bullish divergence on both 5 and 15 min, plus a significant increase in volume in 1 min. Moreover, I got a slight (quite slight!) retracement into the rainbow. I take it this would have been an adequate 'BRC' just prior to the trade? Or do you prefer a somewhat stronger retracement? Would have fetched 8 pips, but you could have got 10 if you felt the FPV line would break.

Thanks again.
Attached Image (click to enlarge)
Click to Enlarge

Name: trade2.PNG
Size: 35 KB
 
 
  • Post #23,745
  • Quote
  • May 15, 2012 8:28am May 15, 2012 8:28am
  •  MissPips
  • Joined Jul 2008 | Status: #welcomebackGator | 2,418 Posts
I prefer but the chances of getting it in that situation aren't good because the 5, 15 and 30 trixes all flipped together right there, together with a double bottom with divergence on the 5, 15 and 30 m charts. The TDI was out of bounds there on multiple timeframes, the stochastics were pointing up in all timeframes and the 60 m trix was crosssed up. The rainbow had a double flip up with the aqua band showing on both the 1 and 5. In those cases you have to just jump on because odds are there won't be a good retrace for a while. I don't use the CCI that much but I do have a separate chart with it and the TDI for checking if I want to take a divergence trade against the trend, and I do find it's useful to filter those trades on the 5 m chart. Since trading against the trend is riskier you want to make sure it's a real good divergence before doing it, or alternately if the TDI and CC don't confirm, you can rule out not taking a trade with the trend just because there was 'fake' divergence caused by consolidation that's likely to carry on with the trend. I love the rb as a visual aid too. I know that there are people who can read PA just looking at the bars, but I find having the colors in there really helps me see what's going on.

Quoting W.Pigeon
Disliked
Cheers Miss Pips! Yeah I'll take that on board, thanks. I've been wondering whether to use a separate graph for divergences recently, so I'll give the CCI a go and see how it turns out with relation to what you said. All in all, I've found the rainbow system to be the most helpful in relation to its contraction/expansion cycle. Its possibly one of the most helpful visual aids for trading in general for me.

I had another good setup today - shame I was asleep! I got a strong bullish divergence on both 5 and 15 min, plus a significant increase...
Ignored
 
 
  • Post #23,746
  • Quote
  • Edited 8:51am May 16, 2012 8:15am | Edited 8:51am
  •  MissPips
  • Joined Jul 2008 | Status: #welcomebackGator | 2,418 Posts
Long here.

Considerations:
1 H&S on 5 m chart
2 Triangle breakout and retest on 5m chart
3. All trixes from 5m to 1 h green after consolidation and compression period
Attached Image (click to enlarge)
Click to Enlarge

Name: rb7.jpg
Size: 95 KB


4. Double rainbow flip on 1m chart and 6 lights.
5. Aqua layer showing on both rainbows.
6. BRC of R which becomes S at 2721
7. Higher highs, higehr lows on 1m
8. Nice overextended area on the last low on the 1m rainbow where price goes down and the rainbow doesn't follow it, leaving a gap (usually a sign of a good reversal).
Attached Image (click to enlarge)
Click to Enlarge

Name: rb5.jpg
Size: 85 KB
 
 
  • Post #23,747
  • Quote
  • May 16, 2012 8:25am May 16, 2012 8:25am
  •  ahniel
  • | Joined May 2011 | Status: Member | 54 Posts
Textbook Trade

Bearish Divergence on 5min

Take profit 75% at Fibo 38.2 and take profit 25% at Fibo 50

Still waiting for my Diablo 3 Pre Order
Attached Image (click to enlarge)
Click to Enlarge

Name: eu 1655 16.05.12.gif
Size: 43 KB
Veni, Vidi, Vici
 
 
  • Post #23,748
  • Quote
  • Edited 9:03am May 16, 2012 8:35am | Edited 9:03am
  •  MissPips
  • Joined Jul 2008 | Status: #welcomebackGator | 2,418 Posts
I know we are in a downtrend, but careful with the shorts today. 4 hour charts on gold and euro pointing up.
(First chart is 4 hr EurUDS and second chart is 4 hr gold - tracks EURUSD pretty well on higher timeframes).

Quoting ahniel
Disliked
Textbook Trade

Bearish Divergence on 5min

Take profit 75% at Fibo 38.2 and take profit 25% at Fibo 50

Still waiting for my Diablo 3 Pre Order
Ignored
Attached Image(s) (click to enlarge)
Click to Enlarge

Name: 4hreur.jpg
Size: 62 KB
Click to Enlarge

Name: 4hr gold.jpg
Size: 70 KB
 
 
  • Post #23,749
  • Quote
  • May 16, 2012 8:35am May 16, 2012 8:35am
  •  Dufoo
  • | Joined Sep 2011 | Status: Member | 70 Posts
I am using your tamplate Rbema3, but mine RB is not making that gap- it follows the price... Have You done some changes?

Quoting MissPips
Disliked
Long here.

8. Nice overextended area on the last low on the 1m rainbow where price goes down and the rainbow doesn't follow it, leaving a gap (usually a sign of a good reversal).
Attachment 963651
Ignored
 
 
  • Post #23,750
  • Quote
  • May 16, 2012 8:49am May 16, 2012 8:49am
  •  MissPips
  • Joined Jul 2008 | Status: #welcomebackGator | 2,418 Posts
See this post about difference between EMA rainbow and Bemac's rainbow.

http://www.forexfactory.com/showthre...82#post5645182

and also this about how the VarMa works

http://www.traderslaboratory.com/for...-research.html

Quoting Dufoo
Disliked
I am using your tamplate Rbema3, but mine RB is not making that gap- it follows the price... Have You done some changes?
Ignored
 
 
  • Post #23,751
  • Quote
  • May 16, 2012 9:52am May 16, 2012 9:52am
  •  ahniel
  • | Joined May 2011 | Status: Member | 54 Posts
Another textbook trade

1 Double top at 5min
2 Cross of PA trend line
3 Confluence (can't remember that spelling) PA trend line and Fibo at 127.2

Take profit 75% at Fibo 100 and 25% at fibo 78.6

About 18 pips

I think there is going to be another good trade soon as Daily Average is 100 and we are only at 77 but I have to go out. Darn
Attached Image (click to enlarge)
Click to Enlarge

Name: eu 2157 16.05.12.gif
Size: 44 KB
Veni, Vidi, Vici
 
 
  • Post #23,752
  • Quote
  • May 16, 2012 11:18am May 16, 2012 11:18am
  •  MissPips
  • Joined Jul 2008 | Status: #welcomebackGator | 2,418 Posts
Nice example of how two people with opposite outlooks for the day can both make money as long as they get the entry right and don't get greedy.

Quoting ahniel
Disliked
Another textbook trade

1 Double top at 5min
2 Cross of PA trend line
3 Confluence (can't remember that spelling) PA trend line and Fibo at 127.2

Take profit 75% at Fibo 100 and 25% at fibo 78.6

About 18 pips

I think there is going to be another good trade soon as Daily Average is 100 and we are only at 77 but I have to go out. Darn
Ignored
 
 
  • Post #23,753
  • Quote
  • May 17, 2012 5:21am May 17, 2012 5:21am
  •  kevinpham
  • | Joined Jun 2011 | Status: Member | 86 Posts
Hello all THV4 traders,

I am still demoing the system and would like to know if we can have a higher time frame coral like M15 in M5?

I open up the coral MQ4 file but so ignorant to know which value to change and search the thread but no one has the same question as mine.

The reason i am asking for help is that with 2 corals I may filter out some bad trades that I had while using it, however it may limiting the trades

thanks all and wish everyone getting pips
 
 
  • Post #23,754
  • Quote
  • May 17, 2012 8:39am May 17, 2012 8:39am
  •  MissPips
  • Joined Jul 2008 | Status: #welcomebackGator | 2,418 Posts
http://www.forexfactory.com/showthre...03#post3814103

Quoting kevinpham
Disliked
Hello all THV4 traders,

I am still demoing the system and would like to know if we can have a higher time frame coral like M15 in M5?

I open up the coral MQ4 file but so ignorant to know which value to change and search the thread but no one has the same question as mine.

The reason i am asking for help is that with 2 corals I may filter out some bad trades that I had while using it, however it may limiting the trades

thanks all and wish everyone getting pips
Ignored
 
 
  • Post #23,755
  • Quote
  • May 19, 2012 8:16am May 19, 2012 8:16am
  •  pigwiddeon
  • | Joined Apr 2011 | Status: Member | 12 Posts
hi all,

i just want to ask that can someone upload or give me the link of the last templates-indicators of this system? First post is very old and people use other indicators as I see in the last pages.

Thanks in advance
 
 
  • Post #23,756
  • Quote
  • May 20, 2012 12:04pm May 20, 2012 12:04pm
  •  befkaz
  • | Joined May 2012 | Status: Junior Member | 2 Posts
Quoting cobraforex
Disliked
OK, let’s talk one moment about one of the indicators, The Fibonacci Pivot level indicator.

Those levels are calculated on the broker’s prior day HLC data, they are respected points where the PA may pause, bounce back or break and retest.
They are calculated on your brokers daily open and close time, now what will be the best broker time to watch them?
[color=black]I have the Fibonacci Pivot indicator since more than 2 years on my chart and found it absolutely best on GMT London time (ex. ODL, IBFX...
Ignored


How can i get copy f the attached pivot indicator
 
 
  • Post #23,757
  • Quote
  • May 20, 2012 9:07pm May 20, 2012 9:07pm
  •  Zimarz
  • | Joined Apr 2012 | Status: Member | 90 Posts
Quoting pigwiddeon
Disliked
hi all,

i just want to ask that can someone upload or give me the link of the last templates-indicators of this system? First post is very old and people use other indicators as I see in the last pages.

Thanks in advance
Ignored
Hi,
suggest u dwnload fm 1st page THV v3, its the latest version 3 and very good for beginners, and I ve been using it wz positive results.
As for v4, its a bit advance and require more exoeriance.
Just my opinion.

zimarz
Attached Image (click to enlarge)
Click to Enlarge

Name: thv v3.gif
Size: 32 KB
 
 
  • Post #23,758
  • Quote
  • Edited May 21, 2012 12:37am May 20, 2012 10:41pm | Edited May 21, 2012 12:37am
  •  parliament71
  • | Joined Feb 2012 | Status: Member | 43 Posts
I find many of the rules of THV system useful in my other systems, especially the trix indicator. Im trying to code the trix indicator on a different backtesting platform from mt4.

Can somebody please answer two quick questions:

1. Is the trix calculated on the heiken ashi bars or regular price bars?
2. Is is calculated on O/H/L or Close of those bars?

Trying to understand the MQL code just confuses the heck out of me.

Thank you
 
 
  • Post #23,759
  • Quote
  • May 20, 2012 10:55pm May 20, 2012 10:55pm
  •  SEDI
  • | Joined Aug 2006 | Status: Member | 19 Posts
Quoting pigwiddeon
Disliked
hi all,

i just want to ask that can someone upload or give me the link of the last templates-indicators of this system? First post is very old and people use other indicators as I see in the last pages.

Thanks in advance
Ignored

i use template from Mihailo.Quite nice and very informative.but if you like a simpler one,maybe u can change or delete any unwanted indicators in the system.just in my opinion
 
 
  • Post #23,760
  • Quote
  • May 20, 2012 11:50pm May 20, 2012 11:50pm
  •  befkaz
  • | Joined May 2012 | Status: Junior Member | 2 Posts
Quoting Zimarz
Disliked
Hi,
suggest u dwnload fm 1st page THV v3, its the latest version 3 and very good for beginners, and I ve been using it wz positive results.
As for v4, its a bit advance and require more exoeriance.
Just my opinion.

zimarzAttachment 966474
Ignored


Could you please provide the link to download the first one i requested for and zimarz
 
 
  • Trading Systems
  • /
  • THV system, final edition
  • Reply to Thread
    • 1 11861187Page 118811891190 1295
    • 1 Page 1188 1295
2 traders viewing now
  • More
Top of Page
  • Facebook
  • Twitter
About FF
  • Mission
  • Products
  • User Guide
  • Media Kit
  • Blog
  • Contact
FF Products
  • Forums
  • Trades
  • Calendar
  • News
  • Market
  • Brokers
  • Trade Explorer
FF Website
  • Homepage
  • Search
  • Members
  • Report a Bug
Follow FF
  • Facebook
  • Twitter

FF Sister Sites:

  • Metals Mine
  • Energy EXCH
  • Crypto Craft

Forex Factory® is a brand of Fair Economy, Inc.

Terms of Service / ©2023