• Home
  • Forums
  • Trades
  • News
  • Calendar
  • Market
  • Brokers
  • Login
  • Join
  • 6:10pm
Menu
  • Forums
  • Trades
  • News
  • Calendar
  • Market
  • Brokers
  • Login
  • Join
  • 6:10pm
Sister Sites
  • Metals Mine
  • Energy EXCH
  • Crypto Craft

Options

Bookmark Thread

First Page First Unread Last Page Last Post

Print Thread

Similar Threads

TMA Reality Tour 114 replies

Looking for an EA using TMA indicator 5 replies

MTF TMA 287 replies

Happs with TMA Trading Journal 23 replies

SnakeForce - simple TMA with alert? 3 replies

  • Trading Systems
  • /
  • Reply to Thread
  • Subscribe
  • 3,139
Attachments: Extreme TMA System
Exit Attachments
Tags: Extreme TMA System
Cancel

Extreme TMA System

  • Last Post
  •  
  • 1 489490Page 491492493 810
  • 1 Page 491 810
  •  
  • Post #9,801
  • Quote
  • Apr 23, 2012 4:01pm Apr 23, 2012 4:01pm
  •  darshanag
  • | Joined Oct 2011 | Status: Member | 63 Posts
Quoting flaw
Disliked
They are the same but in different format. If you know a little bit about programming then you know the difference. If not then just load either one of them in MT4, it'll work. Frank
Ignored
 
 
  • Post #9,802
  • Quote
  • Apr 23, 2012 4:07pm Apr 23, 2012 4:07pm
  •  sabrys5769
  • | Joined Jun 2010 | Status: Member | 228 Posts
Quoting Alorente
Disliked
Here is a fantastic indi that takes up very little screen real estate.

It gives the ADX value for M1, M5, M15, M30, H1 and H4.

In case you don´t know, ADX is a great Trend indicator. An ADX value below 20 indicates Ranging. Above 20 a Trend Up or Down. Above 40 a Very Strong Trend. The indi will not only give you the value, it also shows Green if Trend is Up or Red if Trend is down, plus the rate of change in the trend. All in one Row of data. Fantastic.
Ignored
I put it in all my charts .. I really like it... thank you Al
 
 
  • Post #9,803
  • Quote
  • Apr 23, 2012 5:11pm Apr 23, 2012 5:11pm
  •  a4b4c4
  • | Joined Dec 2011 | Status: Member | 27 Posts
we can Convert this system to ea right?
 
 
  • Post #9,804
  • Quote
  • Apr 23, 2012 5:31pm Apr 23, 2012 5:31pm
  •  MMGood47
  • | Joined Nov 2009 | Status: Member | 107 Posts
Quoting Alorente
Disliked
Sabry, my perfect trade is when M15, H1 and H4 are all Buys or Sells on the Dashboard. They can be Grey and not all colored.

My second best trade is when M5, M15 and H1 are all Buys or Sells on the Dashboard. Again, they don´t all have to be colored. They can be Grey. I have not lost on those trades yet.
Ignored
Out of curiosity, Al do you have TrixFilter and TrixDivergence enabled when you look for the buys and sells? Just wondering if I have the same settings you are referring to.
Thanks

P.S. I would like to study the basket trade that you mentioned earlier. If you could tell me the relevant info I would need to study that I would really appreciate it. Thank You so much my friend.
 
 
  • Post #9,805
  • Quote
  • Apr 23, 2012 9:44pm Apr 23, 2012 9:44pm
  •  abqkidd
  • | Joined Apr 2012 | Status: Member | 15 Posts
Quoting Alorente
Disliked
Here is a fantastic indi that takes up very little screen real estate.

It gives the ADX value for M1, M5, M15, M30, H1 and H4.

In case you don´t know, ADX is a great Trend indicator. An ADX value below 20 indicates Ranging. Above 20 a Trend Up or Down. Above 40 a Very Strong Trend. The indi will not only give you the value, it also shows Green if Trend is Up or Red if Trend is down, plus the rate of change in the trend. All in one Row of data. Fantastic.
Ignored

Thanks Al. I really like it. Is there a way to stack the diferent ADX's vertical instead of single line horizontal? It takes a big chart to be able to see all of them up to H4 which is way to the right. maybe I'm missing something as I'm still learning MT4
 
 
  • Post #9,806
  • Quote
  • Apr 23, 2012 11:36pm Apr 23, 2012 11:36pm
  •  PeepCzar
  • | Joined Jan 2012 | Status: Member | 83 Posts
Hi Al,

I keep reading page 1 again and again to make sure I fully understand with every single word you wrote. I came across the wording: ..."The further price moves across the bands, the more reliable the trade will be". My interpretation on this wording would be either,

1. If the price moves up higher, say 15+ pips above the upper band before taking short, the chance of a successful trade is bigger than if the price is just few pips away from the upper band. (Note: the opposite is true for long)

or,

2. If the price moves across the bands with a large TMA Size (say, 30+ pips in M15), then the chance of a successful trade in the opposite direction is bigger than a trade with a small TMA size.

Sorry, if I bother you with this question, but please clarify what you really mean.

Thanks in advance...
To excel by continuous learning
 
 
  • Post #9,807
  • Quote
  • Apr 24, 2012 2:01am Apr 24, 2012 2:01am
  •  Connected
  • | Membership Revoked | Joined Mar 2012 | 860 Posts
http://www.hostmypic.net/pictures/50...5b97e55623.jpg
Tracking the Specialists.
 
 
  • Post #9,808
  • Quote
  • Apr 24, 2012 2:57am Apr 24, 2012 2:57am
  •  imbonitore
  • | Joined Jan 2012 | Status: Member | 262 Posts
24th Apr 2012


Narrow ranges for EURUSD - the FOMC meeting could change all of that


The week got off to a bit of RISK OFF sentiment based on the political problems seen in France, the Netherlands and possibly also for Czech.
The reactions were limited though – with a drop for EURUSD of approx. 100 pips – which is within the daily range seen lately.
Equities were red all over Europe yesterday and so was also the start of the US session but there equities recovered a bit towards the end, lifting EURUSD also off its low – recovering almost half of the loss intraday.
Today – focus will be on Italy’s auction of 2, 5 and 7 year bonds. Timing might not look too good for these auctions as spreads between German and Italian 10 year bonds was more than 408 pips yesterday, the highest spread seen in 3 months. As Italy is the biggest borrower in Europe, ultimately it is the confidence in this market which is the most important factor when assessing ECB’s possibilities to manage the debt crisis short-term.
Other than that, the European calendar is pretty thin and the items also from the US session are not really market movers. Consumer confidence should attract some interest while Richmond Fed is a bit neglected these days.
The US session will likely be capped pretty much today as focus now turns to the biggest event of the week: the FOMC meeting tomorrow.
Please note that there are three elements to focus on in respect of this meeting:
At 16h30 the FOMC will release its rate decision, which is almost a non event as no one predict any rate changes
At 18h00 the FOMC will release its projections or outlook for short-term interest rates. This is a new feature of their publicity activity and one to pay notice to. It is like the Fed’s forecast for USD short-term interest rates and it likely will also say something about the yield-curve activities they have been conducting or “switching” as it has been called. IS this an activity completed or is it one to continue? Ultimately it can also give some clues to whether further easing is on the cards.
At 18h15 Bernanke holds his press conference after the FOMC meeting and this is one to pay notice to. This could be a 150-200 pips event should there be any hints here that Fed does not think the economy is progressing fast enough and that further easing has been discussed or will be. Any hints to further easing will bring QE3 back as focus for markets and that is a USD bearish signal of significance as QE programs are all about printing USD.
A QE3 has been on and off for more markets’ attention now for more than 6 months. The earlier signs that the economy was progressing – as seen through better employment data – has cooled off significantly. The reason for this is that domestic demand is not picking up in the US and that is where the Fed wants to see it. Domestic demand is the main GDP mover.
I would say that if Bernanke is not mentioning anything of further easing then EURUSD could drop possible 100 pips or so and depending on where we are from start – might challenge the upper levels of support areas as seen lately.
Should there be a hint of easing or something along the lines where the market will see as a QE3 in pipeline – then the opposite move will take place and you could see the short-term effect of that being a EURUSD spike of 200+ pips – likely taking out the resistance areas as seen of lately.
Thursday there is a mixed basket of sentiment indices in Europe, German CPI, weekly jobless claims in the US, Chicago Fed and US pending home sales. These items are likely only causing minor adjustments to whatever the market reaction will be to the FOMC meeting.

Friday sees the release of 1st quarter US GDP figures and its main components. This is a major event to finish the week - BUT – you can be SURE the Fed has seen the first draft of these figures by the time they have their meeting on Wednesday. AS such – from whatever the FOMC is doing or Bernanke says, a lot of it will be based on the data to be released to us 2 days later. This neutralizes the effect of GDP figures – and more explains why the FOMC did or did not do 2 days earlier.
I will be way for 9 days as of lunch-time today. I have started building a small long EURUSD – really low leverage – which I hope to get at an average level as close to the low area of 1.3000 as possible. I am a strong believer that this level is attractive and will in broad terms hold as support.
The EURUSD might be capped to the upside on many levels. The nearest is the 1.3200-25 level, which many now see as strong resistance. To me it might or might not be. But I see any breakout to be to the upside and as I have a sort of 10 day outlook for this, my target is the upper level of the range we have seen for 3 months now – close to the 1.3450 level. In fact – I see this level also to break – but likely later.
The strategy is valid for me as long as I see 1.2975 and a even a few pips below – to hold.
That is as much as there is to be said from my part. I wish you all the best of luck and progress in your trading. I will be back with further updates on 3rd May.


from Tor
 
 
  • Post #9,809
  • Quote
  • Apr 24, 2012 3:47am Apr 24, 2012 3:47am
  •  Alorente
  • Joined Aug 2011 | Status: Member | 4,593 Posts
Quoting 5abi
Disliked
Al,

What do you think about this pair? NZD CAD? Any chance it may be going up, the blue bands are H4 time frame?

thnx
Ignored
It looks oretty good for a long but it is almost out of the range.
Observation is the path to discovery.
 
 
  • Post #9,810
  • Quote
  • Apr 24, 2012 3:49am Apr 24, 2012 3:49am
  •  Alorente
  • Joined Aug 2011 | Status: Member | 4,593 Posts
Quoting Xabier
Disliked
AL para una venta como ves este par estaria bien para una venta hay divergencias en trix y el slope
Ignored
Tiene buena pinta pero Cad va a bajar tambien. Quizás baje menos que Gbp.
Observation is the path to discovery.
 
 
  • Post #9,811
  • Quote
  • Apr 24, 2012 3:50am Apr 24, 2012 3:50am
  •  Alorente
  • Joined Aug 2011 | Status: Member | 4,593 Posts
Quoting bfis108137
Disliked
If you have a trade that has made it to the other side of the tma but because of an early entry that trade is actually a loss, do you close it or wait for break even? What if you are using recovery and it hasn't gotten to break even for the combined total of all trades?
Ignored
In the Recovery rules it specifies each step. After Level 4, you begin taking a loss on the first trade first.
Observation is the path to discovery.
 
 
  • Post #9,812
  • Quote
  • Apr 24, 2012 3:52am Apr 24, 2012 3:52am
  •  Alorente
  • Joined Aug 2011 | Status: Member | 4,593 Posts
Quoting MMGood47
Disliked
Out of curiosity, Al do you have TrixFilter and TrixDivergence enabled when you look for the buys and sells? Just wondering if I have the same settings you are referring to.
Thanks

P.S. I would like to study the basket trade that you mentioned earlier. If you could tell me the relevant info I would need to study that I would really appreciate it. Thank You so much my friend.
Ignored
No. I look at those visually. With those enabled you will get almost no signals.
Observation is the path to discovery.
 
 
  • Post #9,813
  • Quote
  • Apr 24, 2012 3:53am Apr 24, 2012 3:53am
  •  Alorente
  • Joined Aug 2011 | Status: Member | 4,593 Posts
Quoting abqkidd
Disliked
Thanks Al. I really like it. Is there a way to stack the diferent ADX's vertical instead of single line horizontal? It takes a big chart to be able to see all of them up to H4 which is way to the right. maybe I'm missing something as I'm still learning MT4
Ignored
No.
Observation is the path to discovery.
 
 
  • Post #9,814
  • Quote
  • Apr 24, 2012 3:56am Apr 24, 2012 3:56am
  •  Alorente
  • Joined Aug 2011 | Status: Member | 4,593 Posts
Quoting PeepCzar
Disliked
Hi Al,

I keep reading page 1 again and again to make sure I fully understand with every single word you wrote. I came across the wording: ..."The further price moves across the bands, the more reliable the trade will be". My interpretation on this wording would be either,

1. If the price moves up higher, say 15+ pips above the upper band before taking short, the chance of a successful trade is bigger than if the price is just few pips away from the upper band. (Note: the opposite is true for long)

or,

2. If the price moves across...
Ignored
I mean both. My most successful trades have started well beyond the bands. It is like a spring. The more stretched it is the stronger it will return to equilibrium. Of course, you must still be in the Ranging zone before you enter. I am skeptical of numbers above 0.40 or below -0.40. When I see those I tend to wait for lower ranging numbers.
Observation is the path to discovery.
 
 
  • Post #9,815
  • Quote
  • Apr 24, 2012 3:58am Apr 24, 2012 3:58am
  •  Alorente
  • Joined Aug 2011 | Status: Member | 4,593 Posts
Quoting Connected
Disliked
http://www.hostmypic.net/pictures/50...5b97e55623.jpg
Ignored
Thanks. GU is going to snap back fast at some point. EU also looks like a fall waiting to happen.
Observation is the path to discovery.
 
 
  • Post #9,816
  • Quote
  • Apr 24, 2012 4:04am Apr 24, 2012 4:04am
  •  Alorente
  • Joined Aug 2011 | Status: Member | 4,593 Posts
Quoting imbonitore
Disliked
24th Apr 2012


Narrow ranges for EURUSD - the FOMC meeting could change all of that


The week got off to a bit of RISK OFF sentiment based on the political problems seen in France, the Netherlands and possibly also for Czech.
The...
Ignored
I agree that not much will happen till FOMC. I disagree on the direction of the big move. I continue to expect EU to test the low of 1.2640 and break it at some point.

The worse thing that can happen to the US right now is a European collapse. A higher Euro virtually guarantees Europe will have a deeper recession than with a lower Euro. A deeper recession virtually guarantees that the peripheral countries will run into even bigger trouble and would bring Europe much closer to a total collapse. Bernanke knows this. I´m sure they talked about it this weekend. He will not say anything tomorrow that will precipitate this scenario. There will be no mention of QE3. IMHO.
Observation is the path to discovery.
 
 
  • Post #9,817
  • Quote
  • Apr 24, 2012 4:12am Apr 24, 2012 4:12am
  •  Xabier
  • | Joined Mar 2012 | Status: Member | 56 Posts
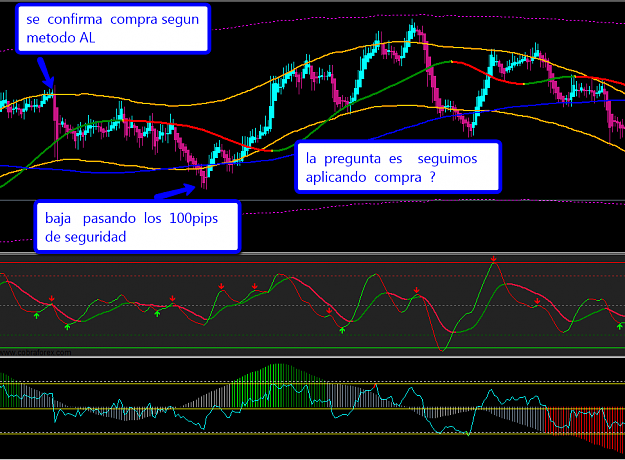
Hola AL referente al metodo Extreme pienso que lo voy conociendo poco a poco y apenas tengo dudas .en el aspecto de la recuperacion entiendo que si aplicamos una venta el sl de seguridad es de 100 pips la duda es despues que aplicamos una venta al doble de lotaje ?
o por el contrarioesperamos que se produzca una compra pues el precio habra salido de la tma despues de la bajada de 100 se sl de seguridad te muestro un grafico pues explicandome no soy muy eficaz .muchas gracias un saludo Xabi
Attached Image (click to enlarge)
Click to Enlarge

Name: recuperacion.png
Size: 61 KB
 
 
  • Post #9,818
  • Quote
  • Apr 24, 2012 6:03am Apr 24, 2012 6:03am
  •  grechmar
  • | Joined Feb 2012 | Status: Member | 186 Posts
Quoting Alorente
Disliked
I agree that not much will happen till FOMC. I disagree on the direction of the big move. I continue to expect EU to test the low of 1.2640 and break it at some point.

The worse thing that can happen to the US right now is a European collapse. A higher Euro virtually guarantees Europe will have a deeper recession than with a lower Euro. A deeper recession virtually guarantees that the peripheral countries will run into even bigger trouble and would bring Europe much closer to a total collapse. Bernanke knows this. I´m sure they talked about it...
Ignored
Yes, i agree with Al. This makes much more sense, while the EU continue to "hope" for a better situation, the US has a much more unbiased view and knows EU is in bad waters. It would e too much risk to appreciate euro now for much worse results later.
 
 
  • Post #9,819
  • Quote
  • Apr 24, 2012 6:05am Apr 24, 2012 6:05am
  •  grechmar
  • | Joined Feb 2012 | Status: Member | 186 Posts
Quoting Alorente
Disliked
Here is a fantastic indi that takes up very little screen real estate.

It gives the ADX value for M1, M5, M15, M30, H1 and H4.

In case you don´t know, ADX is a great Trend indicator. An ADX value below 20 indicates Ranging. Above 20 a Trend Up or Down. Above 40 a Very Strong Trend. The indi will not only give you the value, it also shows Green if Trend is Up or Red if Trend is down, plus the rate of change in the trend. All in one Row of data. Fantastic.
Ignored
Do you use this in the expectation of a reversal or the continuation of a trend? Or both?
Both meaning: when its rising more than 20 u expect continuation, when it has been over 40 for a while you expect reversal?
Would you enter a trade who has just struck 30?
 
 
  • Post #9,820
  • Quote
  • Apr 24, 2012 6:11am Apr 24, 2012 6:11am
  •  bassramy
  • Joined Apr 2011 | Status: Cut Your Losses, Ride Your Winners. | 2,898 Posts
Quoting imbonitore
Disliked
24th Apr 2012


Narrow ranges for EURUSD - the FOMC meeting could change all of that


The week got off to a bit of RISK OFF sentiment based on the political problems seen in France, the Netherlands and possibly also for Czech....
Ignored
Kindly note the descending triangle on EUR/USD D1 chart that the big boys are building prior of breaking it down.

Thank You
Master Your Setup, Master Your self. (NQoos)
 
 
  • Trading Systems
  • /
  • Extreme TMA System
  • Reply to Thread
    • 1 489490Page 491492493 810
    • 1 Page 491 810
2 traders viewing now
  • More
Top of Page
  • Facebook
  • Twitter
About FF
  • Mission
  • Products
  • User Guide
  • Media Kit
  • Blog
  • Contact
FF Products
  • Forums
  • Trades
  • Calendar
  • News
  • Market
  • Brokers
  • Trade Explorer
FF Website
  • Homepage
  • Search
  • Members
  • Report a Bug
Follow FF
  • Facebook
  • Twitter

FF Sister Sites:

  • Metals Mine
  • Energy EXCH
  • Crypto Craft

Forex Factory® is a brand of Fair Economy, Inc.

Terms of Service / ©2023