Hi,
what do you think about this trade?
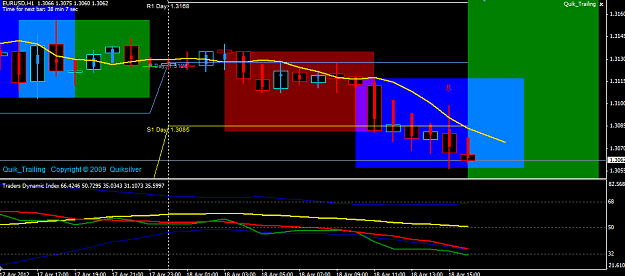
Rules are met for this trade.
Bounce of EMA 60/EMA200.
Divergence, out of blue bands, lower highs.
Ignored
Price just recently bounced from the channel. It's a crapshoot as to whether it will break through or bounce back down to the channel for a second re-test. Be cautious in these scenarios, and look for multiple PA confirmations.
FWIW, I'm eyeing this same trade as well for a shorter term trade, back down to to the 105.00 level. However, I need more confirmation from PA besides the first very small candle.
Hi,
what do you think about this trade?
Rules are met for this trade.
Bounce of EMA 60/EMA200.
Divergence, out of blue bands, lower highs.
Ignored
Hi,
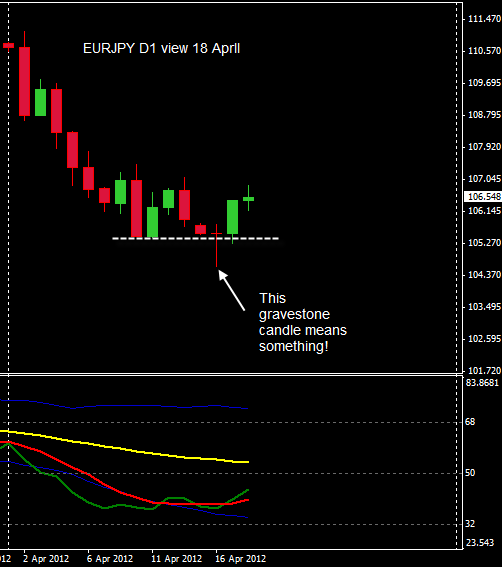
I dont see the bounce off EMA200.
TDI divergence looks ok.
My concern is yesterday's bullish candle coming off the base 105.40, hence maybe too bullish for a reversal so early and this may put your SL at higher risk.
Anyway, now it is up to how your exit management skill.
Attached Image
Honesty is a very expensive gift. You wont find it in cheap people.WBuffett
I thought I understood this system, but it seems, that need to practice more.
Thank you, for your answers.
Ignored
I think that you have a decent handle on the system (the rules, requirements, etc). What you need to work on is knowledge of PA. I'm still working on this myself, as this is very new to me.
Just because the system rules are met and the indicators signal a trade, it does not mean that you enter immediately. You MUST observe PA and make sure that price is following through on the signal. Remember, PA is king, and is the only thing that tells the whole story. Indicators only help you read the PA. Your indicators can signal a trade all day long, but without price action following through, the market will slap you in the face every time.
I thought I understood this system, but it seems, that need to practice more.
Thank you, for your answers.
Ignored
Hi IenDzi,
I think you already know the S3 rules quite well. But IMHO, these are only 5% or even lesser what we need to succeed. The other 10% will be in learning price action and technical analysis like knowing how to identify waves, channeling techniques, price patterns, etc. Yet the rest 80% will be on money management, trading psychology and learning how to manage our trading psychology.
It is hard work but very worth it because it is one way to achieve financial freedom. You need to determined and work diligently towards your goal to succeed.
Can you sacrifice 10,000 hours over the next 3 to 5 years to become a succesful trader? You need a plan to do this.
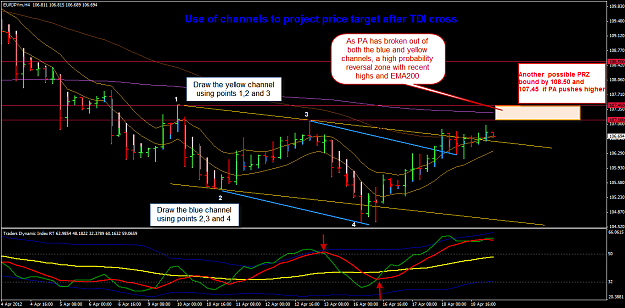
BTW, I did an update review on EURJPY. See attached.
Regards,
Attached Image (click to enlarge)
Honesty is a very expensive gift. You wont find it in cheap people.WBuffett
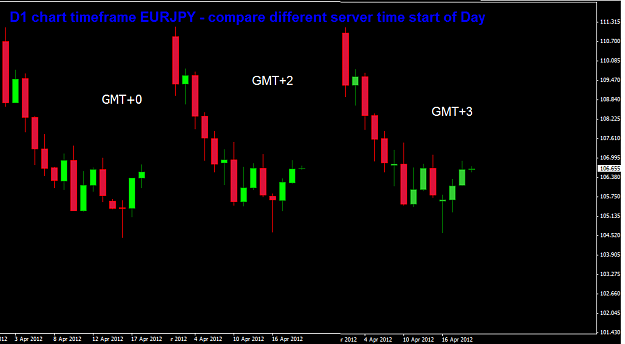
I got a few PMs asking me which server time is more reliable to use in trading. It was referring to the EURJPY chart I posted yesterday and mentioning the gravestone candle.
I don't think there is a correct answer to the reliability of the chart time to use. The price is all the same no matter what the start of day time of your broker data. Only the period candle/bar for e.g. the OHLC will be different, usually differs by 1 to 3 hours of price data.
What I think is more important is consistency in using the selected broekr data.
I chose GMT+0 for all my analysis simply because I can easily reference to each different market session open and close. And also becasue I travel to different time zone and I do not want to adjust my computer when I am in another time zone.
There are some small differences when we use candlestick patterns and these usually appear different. But I had not face any major trading disaster. See attached example.
Attached Image (click to enlarge)
Honesty is a very expensive gift. You wont find it in cheap people.WBuffett
I think you already know the S3 rules quite well. But IMHO, these are only 5% or even lesser what we need to succeed. The other 10% will be in learning price action and technical analysis like knowing how to identify waves, channeling techniques, price patterns, etc. Yet the rest 80% will be on money management, trading psychology and learning how to manage our trading psychology.
It is hard work but very worth it because it is one way to achieve financial freedom. You need to determined and work diligently towards your goal to succeed....
Ignored
Hi, emmanuel7788
How you identify that another possible PRZ bound will be by 107.45 or 108.50. You draw Fibonacci from D1 graph or something else?
How you identify that another possible PRZ bound will be by 107.45 or 108.50. You draw Fibonacci from D1 graph or something else?
Ignored
for this EURJPY,
practice using a clean H4 chart,...zoom out and see where the significant swing highs and lows,
... no need to look too far back, just the recent weeks.
then look at the RN and BRN
> RN =Round Numbers
> BRN = Big Round Numbers
> week high/low
> month high/low
> look for price base where you see significant price move, e.g. rallies, reversal, continuation bursty moves, etc.
H4 is good enough and can see many details, I use a big monitor 24" because of my worsening eyesight.
Zoom in/out ... all the time.
Honesty is a very expensive gift. You wont find it in cheap people.WBuffett
You MUST observe PA and make sure that price is following through on the signal.
Ignored
Would you please explain or show on a chart what you mean by "following through"? I read this several times now and don't know what it means (probably a language problem).
3 trades in TP. Sell E/U, Sell A/U, Buy U/C. Overall +62 pips. 4H support and resistance level helped in that matter. I'm back in a saddle.
Colored MACD certainly helps (but that's just me).
well you see how price was driven down in 15mins, just keep watch and see how it will unfold .. only after this then the direction will be decided
Ignored
Hi emmanuel,
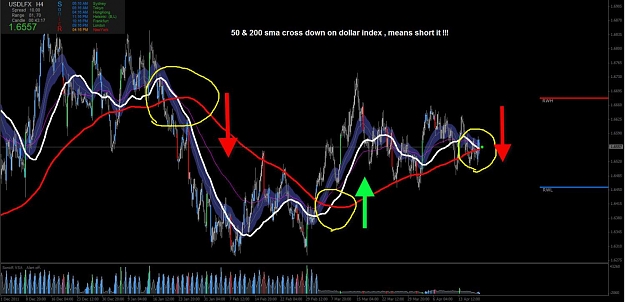
I really like your charts and comments, in return I'd like to present you my little friend Mr.Dollar index
I guess he wants to tell us that he is going down with that little 50 200 sma cross down on 4h chart !!! What do you think ?
I really like your charts and comments, in return I'd like to present you my little friend Mr.Dollar index
I guess he wants to tell us that he is going down with that little 50 200 sma cross down on 4h chart !!! What do you think ?
Ignored
Hi okanemici
thanks for sharing the USDX.
I dont use this in short term trading but knowing the USDX direction is good for long term investments and business.
The spot forex market is too volatile and even being right in the direction, the short term volatility causing wdie price swings remains a challenge to remain in the market.
I think knowing PA well and adopting a consistent approach in technical analysis has more weight plus having a proper money management strategy is far better than reading and using indicators including this USDX.
But having said this, I know there are traders who trade composite currency pairs using this kind of indices.
Regards,
Honesty is a very expensive gift. You wont find it in cheap people.WBuffett