DislikedHi OW,
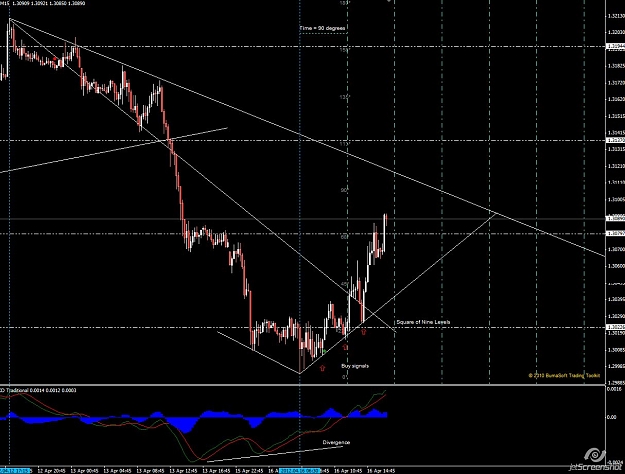
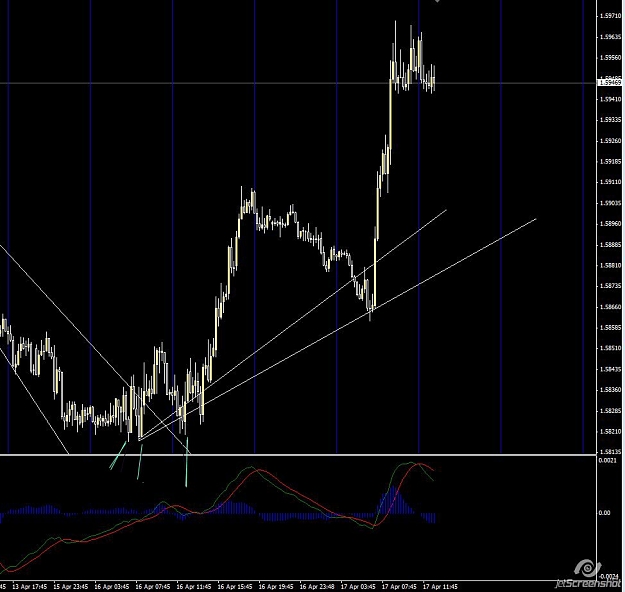
Most of the above sounds doable, in fact this indicator already does some of what you want. The cycle values just need to be added into arrays and then a comparison function checks the count on each new bar - see the text in the bottom left of the chart.
Have you logged into Skype lately....
RegardsIgnored
My suggestion is to do this based upon the Gann timefactor which is earth rotation.
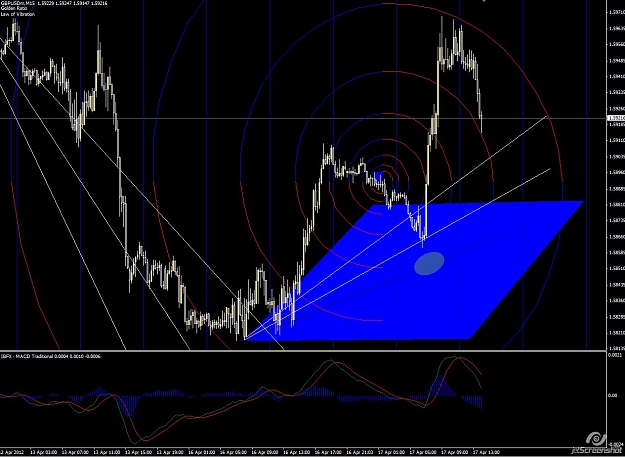
You can add it to the existing arrays, but you have to be carefull not to get cluttered with lines.
As I said, the 4 minute cycle is the smallest cycle. Use cycles with 4 minute intervals and use earth rotation degrees.
45 degrees earth rotation is 3 hours = 180 minutes.
90 degrees earth rotation is 6 hours = 360 minutes.
120 degrees -- "" --- is 8 hours = 480 minutes.
etc.
1 day = 24 hours = 1440 minutes. (144 important number)
Then add days to it as well.
45 days, 90 days, 144 days etc.