Just a quick question for anyone who is willing to answer..
When you are scanning charts looking at 1h, 4h, daily, weekly, etc. do you already have the levels/ PPZ drawn in or are you looking for price action first and then looking to see if the PA has occurred at/near a PPZ level?
Sometimes I find that when looking for PA on my charts first, I'll find it and am able to form fit it in order to make it look like it occurred around a PPZ (whether that PPZ is major or minor is a different story).
In attempt to take away that bias I went in and identified major levels of PPZ that I would be willing to trade if price came close to those levels and then showed some kind of PA. Often times in this scenario I have found that I miss out on plenty of good trades (off of minor PPZ zones and such) because price is usually no where near these huge zones.
So which comes first for each of you individually, PPZ (major or minor?) or PA?
Just a quick question for anyone who is willing to answer..
When you are scanning charts looking at 1h, 4h, daily, weekly, etc. do you already have the levels/ PPZ drawn in or are you looking for price action first and then looking to see if the PA has occurred at/near a PPZ level?
Sometimes I find that when looking for PA on my charts first, I'll find it and am able to form fit it in order to make it look like it occurred around a PPZ (whether that PPZ is major or minor is a different story).
In attempt to take away that bias I went in...
Ignored
Hey Ender
At this point I keep nothing on my charts really, BUT I am very very much in agreement with plotting important areas and waiting for PA there so that we don't curve fit our charts. I think one of the biggest early stumbling blocks is spotting a bar that meets the criteria of being a Pin/outside-bar/etc and then trying to convince ourselves why we SHOULD get in, as opposed to what the story is.
So I do like the idea of spotting good areas first then waiting for PA. Sometimes PA alone is enough but those usually JUMP off the screen
My 2 cents:
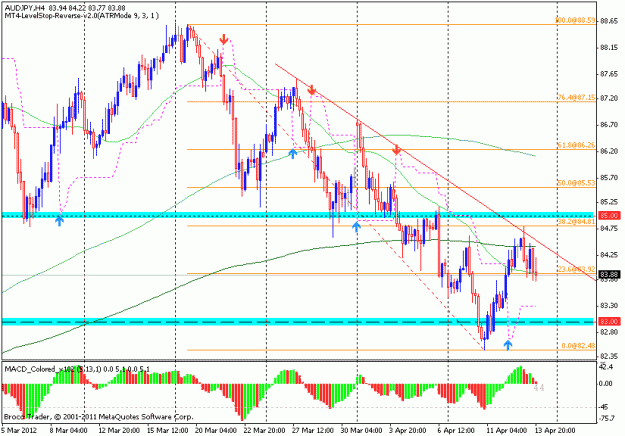
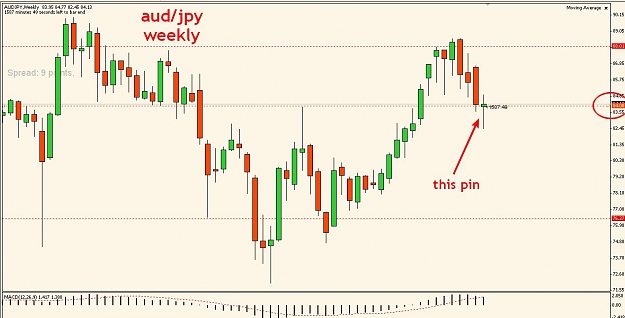
It is almost a neutral bar. The close is not strong and the wick did not protrude enough to reflect a true buying power. Also closed below BRN 85.
My 2 cents:
It is almost a neutral bar. The close is not strong and the wick did not protrude enough to reflect a true buying power. Also closed below BRN 85.
It is a pass.
Ignored
technically is a pinbar but,as cprao say, in pratically a neutral bar whitout space in a bad location; belive me, if you trade somethingh like that just because of it's shape, it's a crime not a pinbar.
open the daily, look the trend, where is started and why.
my 1 cent.
have a nice week!
Sometime the horizon disappear. Twitter: @_whiteout
My 2 cents:
It is almost a neutral bar. The close is not strong and the wick did not protrude enough to reflect a true buying power. Also closed below BRN 85.
It is a pass.
Ignored
Yep very good C and whiteout., also it would be trading back into that box which comes up as a mini box on the weekly chart but price closed well under this. So that support is likely to turn to resistance as we have showed thus far. Also as whiteout pointed I would lean to calling this a neutralish bar too, which is another tip to steer away
Scenario 1: A) If the next bar or closes below 1.3 (strongly, but no BEOB) - do you take the trade ? B) or you wait for the retracement then look for a BEOB at 1.3 area ?
Scenario 2: If consolidation happens above 1.3 and a BEOB forms with a close below 1,3, then I believe - you will be taking a trade on the next bar, right ?
Ignored
Hey C
Correct scenario 1 A wouldn't do anything for me. Also include in there watching of the smaller timeframes as well as also a breakout and pullback to this area on all timeframes and it doesn't have to be just a BEOB. Touch trading these areas are possible too but I don't do that as much.
I'm posting the following because I want to know if I am looking at PA the right way. Please don't think that I am certain about what these charts mean for price movement into next week. I might only be taking one of these trades.
Okay, so looking at what weekly bars have done this past week:
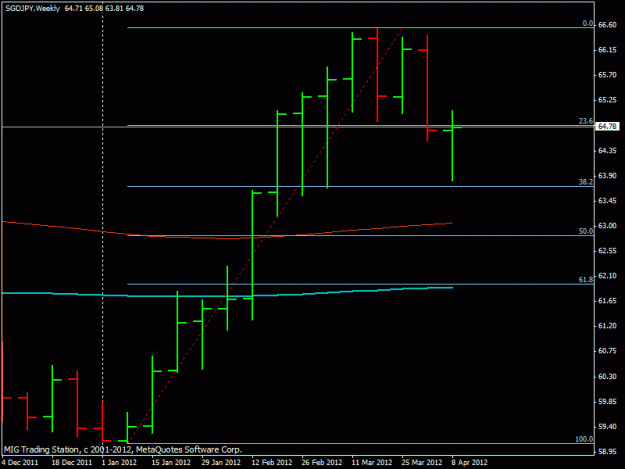
SGDJPY weekly bar shows a nice PB with a 100 pip nose near the 38.2 Fib Line. Good close too. and that's 4 weeks of "space" to the left I believe.
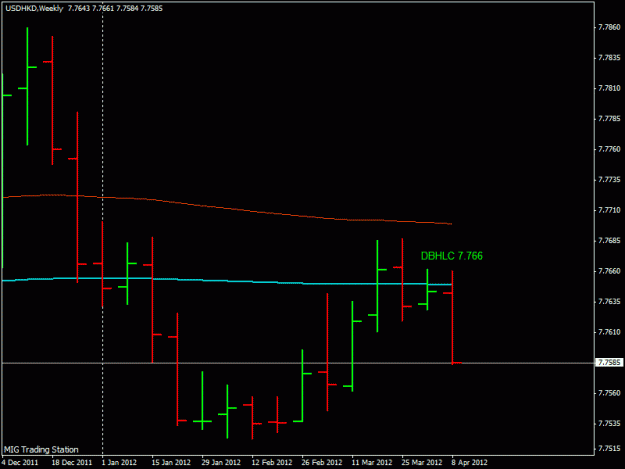
USDHKD showing a weekly DBHLC with the highs at 7.766. I haven't traded this pair before though.
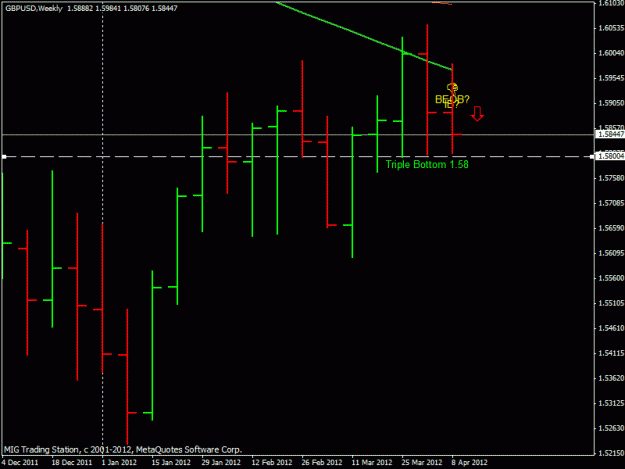
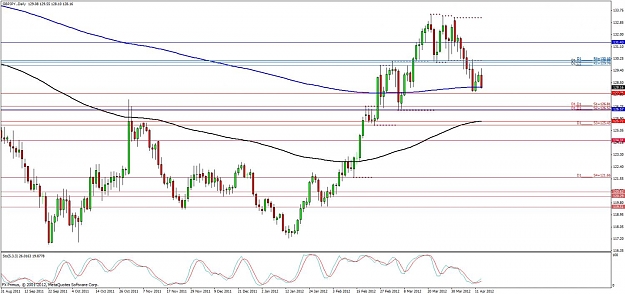
GBPUSD weekly showing triple bottoms at 1.5800 BRN. Maybe trade a breakout? Don't mind the yellow text on the chart, that's for the daily.
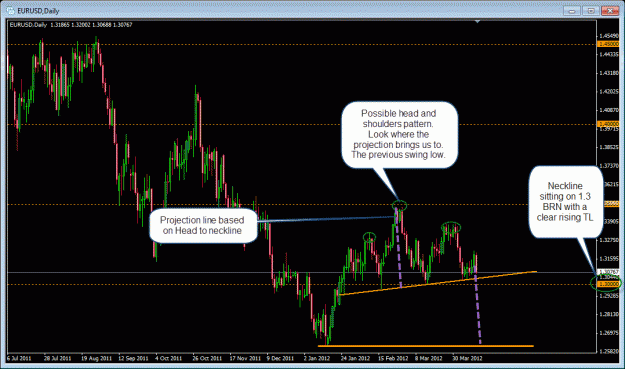
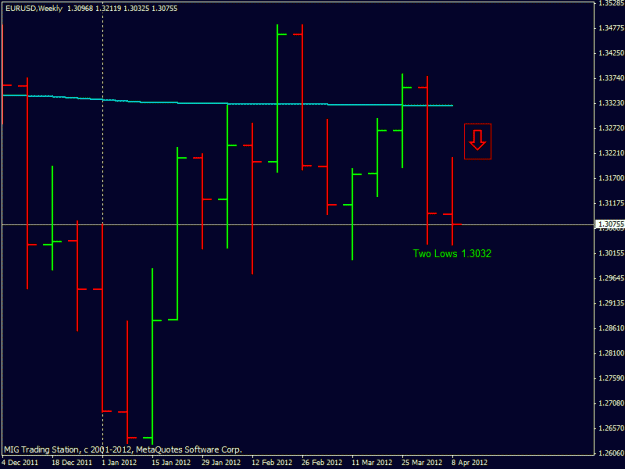
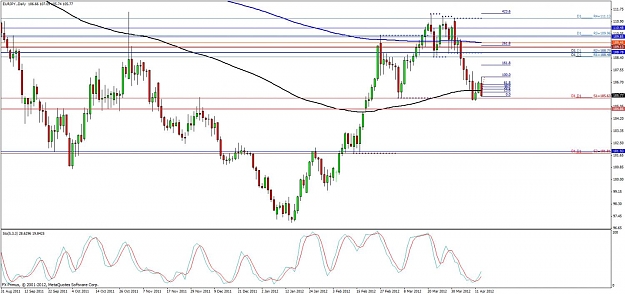
Last but not least, EURUSD weekly showing two lows at 1.3032. Looks like a bearish continuation pattern. Along with what Mbqb11 and Jazzman were saying about a head and shoulders pattern on the daily (thanks for pointing that out guys!), that's just more confirmation. My first thought is that I would trade a downwards breakout of 1.3032, taking partial profits at BRN 1.3000.
So, definitely want to know some thoughts (on the SGDJPY PB especially) and if I'm on the right track so far!
Have a good weekend, it's already Saturday afternoon here lol.
I'm posting the following because I want to know if I am looking at PA the right way. Please don't think that I am certain about what these charts mean for price movement into next week. I might only be taking one of these trades.
Okay, so looking at what weekly bars have done this past week:
SGDJPY weekly bar shows a nice PB with a 100 pip nose near the 38.2 Fib Line. Good close too. and that's 4 weeks of "space" to the left I believe.
USDHKD showing a weekly DBHLC with the highs at 7.766. I haven't traded this pair before though.
GBPUSD...
Ignored
Hey man, im no senior, but having asked some questions like yours previously, I'll give my 2 cents for what its worth,
Pin on SGDJPY is going right back into the bottom of a box that we broke out of. We expect the base of the box to flip to resistance. This is where Mike would say look for the story. It can be more telling than the nice looking bar which we(and definitely me) can get carried away with.
Hmmm, the HKD chart is a BEOB on weekly, but going down to daily for the story, I don't like the look of it. Not a great place. It would be a no for me.
On GBPUSD, it could well go to the bottom of the box, but again we are in a box, and this signal is not strong enough for me, with the FTA being the middle of the box being quite close. Again I would pass.
EURUSD, yup, this is on everyones watch list. I was watching the retest of 1.3200, and took a small touch trade(my first) with very small percent of risk as a tester. Closed at days end with 100 pips, and will resume by looking for PA breaking out of the H & S formation.
This is just my view, but take heart. When I say I was exactly were you are now not so long ago, I mean it! Pestering Mike with every pretty looking pinbar and BEOB.
I was watching the retest of 1.3200, and took a small touch trade(my first) with very small percent of risk as a tester.
Ignored
I've come across the phrase "touch trade" a few times now, what exactly is that?
Thanks for the feedback! I got excited planning for next week haha so I posted those charts. I will keep FTA/PPZs/Boxes in mind.
This is the first week I'm actually looking at more than my usual 3 pairs of EURUSD USDJPY and USDCHF. I got 12 pairs on graph, and since I'm looking at PA on daily charts this way I get more viable PA signals.
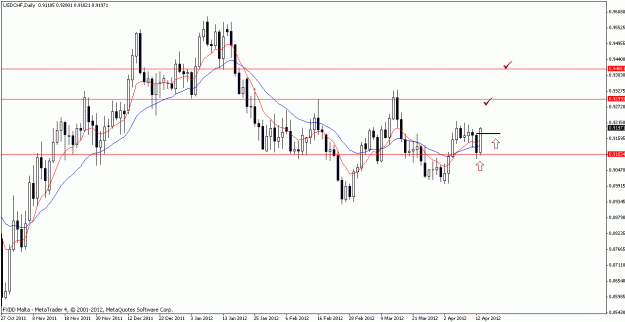
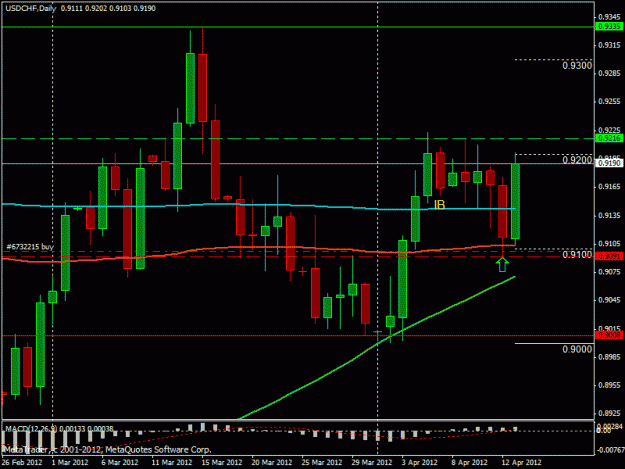
I was in that EURUSD trade too! and also for some reason I was bullish on USDCHF at the same time, I'm not sure why now... There wasn't exactly any PA indication for what I did lol, I guess I was hoping for the 150ema and BRN 9100 to act as support. It worked out well although I closed the trade a bit early. A bit risky perhaps... The other lines on the graph are prev. weekly/ monthly highs and lows.
Edit: I guess there was also a 61.8 fib line right there too at 9089
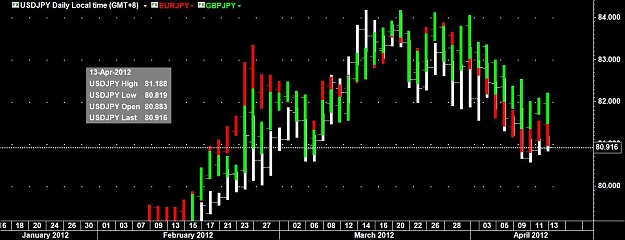
Those look like the exact same charts
I see the EURJPY BEOB but I didn't mark it down here on my chart, because usually the USDJPY and EURJPY charts are highly correlated too but not so much on these 3 most recent daily bars. no BEOB on USDJPY.
Maybe the divergence can be traded, But that depends on if the USDJPY will follow the EURJPY..
edit:
the chart is just to show how the prices are basically layered on top of each other
I just noticed that where the USDJPY made higher highs and where the EURJPY made lower highs, the price then moved higher... I haven't done this divergence trading before though (or with MACD divergence). I hear that divergence trading works well with PA confirmation.
the EMA that you said the BEOB is near.. it is acting as support because price is above it moving downwards, so for a BEOB to be bouncing off of a EMA (confluence), the EMA should be at the high of the BEOB acting as resistance!