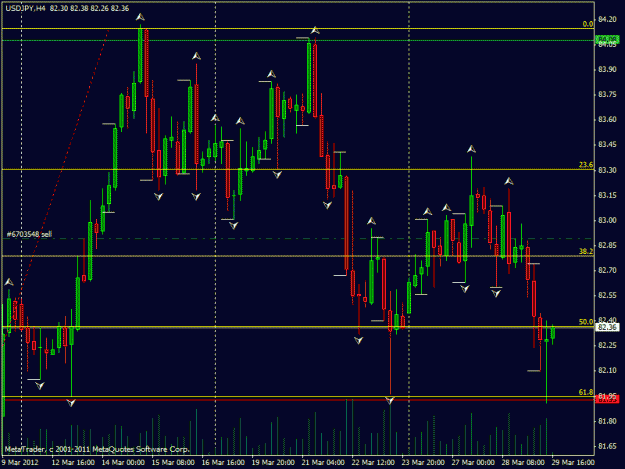
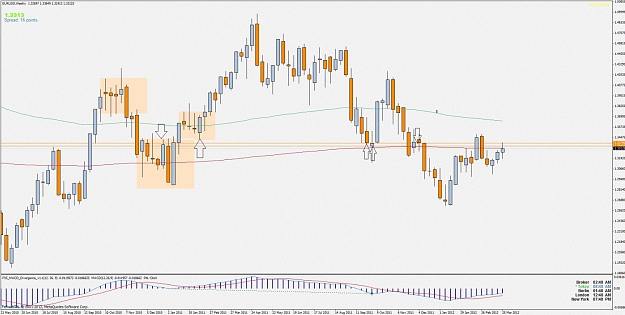
I was just doing more reading here on this thread (great thread, thanks for the summaries everyone) and I looked to charts.. and guess what i found?
Yes, my first pin bar set up ever. It's on USDJPY and I'm really dying to trade... But I actually stopped trading my old EMA crossover today just to study PA.
Okay, I know that this is a 4H chart, so I'm technically not allowed to trade a lower time frame without demoing for 3 months but can someone tell me if this is right so far? There is Confluence of the 61.8 fib line and 81.93 which I marked as the previous week low (it's actually 81.96).
Currently this is a ret to 81.93 from before, two other times on this chart have prices reached this line and gone upwards.
And all this is happening while my EMA cross is telling me to sell (lol).
Edit:
okay so a few posts above me heebbyjeeby spotted this too.. so i guess it isn't news haha.
Edit Edit:
might even have a DBHLC there on the last two candles now!! or am i just seeing things..
Yes, my first pin bar set up ever. It's on USDJPY and I'm really dying to trade... But I actually stopped trading my old EMA crossover today just to study PA.
Okay, I know that this is a 4H chart, so I'm technically not allowed to trade a lower time frame without demoing for 3 months
Currently this is a ret to 81.93 from before, two other times on this chart have prices reached this line and gone upwards.
And all this is happening while my EMA cross is telling me to sell (lol).
Edit:
okay so a few posts above me heebbyjeeby spotted this too.. so i guess it isn't news haha.
Edit Edit:
might even have a DBHLC there on the last two candles now!! or am i just seeing things..
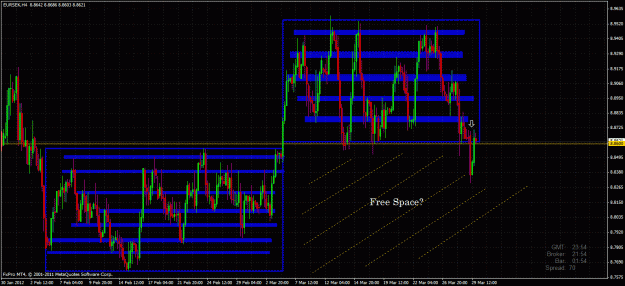
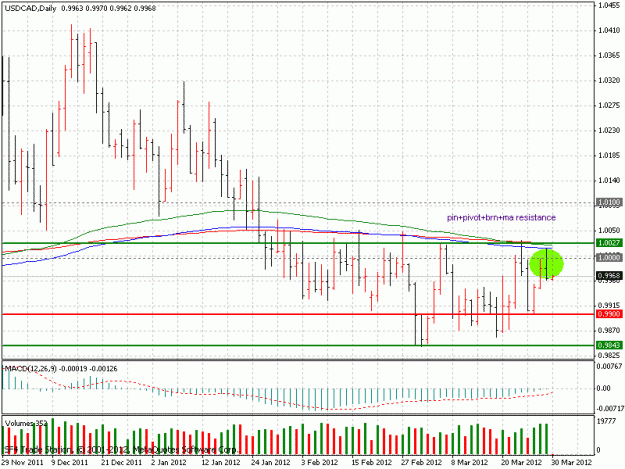
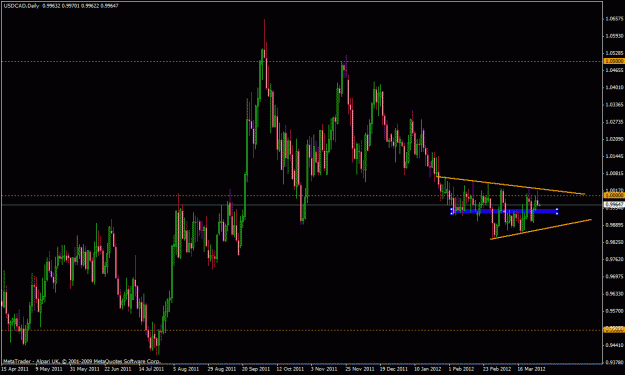
Attached Image (click to enlarge)