hi,
can divergence be seen on TDI??
if can, which line should i use? the green or red line??
Ignored
Hi capad,
It will help you a lot in your trading when you have a deep understanding of how indicators like oscillators work. There is a direct relationshiop between price and oscillators. When there is a huge price movement, it is common that the oscillator will not respond correspondinly in direct proportion because of the period of the oscillator.
TDI is a hybrid indicators using the RSI data interpolated on a moving average.
If you want to trade divergence of the TDI, it is actually the RSI divergence, so it is the green colour line you will look at.
In a huge move like today's, most oscillators will show divergence later.
Many traders will see such divergence easily. What will the market do?
Honesty is a very expensive gift. You wont find it in cheap people.WBuffett
I took losses too today. I am glad we all use stop loss as a way to preserve our capital.
Just look at all pairs and see how many actually have price hit their R3 or S3 pivot levels. This is very rare.
Ignored
Hi,
Yes. SL and TP are important things that we must set when we do not monitor 24/7. I left my house with all my open trades running in positive pips, only to come home and realise 4 hit SL and 1 hit TP.
Looking back again on 4hr and daily TF , i would have actually went short on the USD after my SLs were hit. But too bad i was away from the computer.
Anyway, its good trading experience and I have develop enough confidence to leave the trades running without 24/7 monitoring. This is really impt to me as i really want to trade stress free.
It will help you a lot in your trading when you have a deep understanding of how indicators like oscillators work. There is a direct relationshiop between price and oscillators. When there is a huge price movement, it is common that the oscillator will not respond correspondinly in direct proportion because of the period of the oscillator.
TDI is a hybrid indicators using the RSI data interpolated on a moving average.
If you want to trade divergence of the TDI, it is actually the RSI divergence, so it is the green colour line...
Hi Firsttimer,
Please also give proper explanation about the Post Such as Symbol EURJpy where necessary Long or Short Time frame H1 H4 D1 etc with such a small picture,so that it can be easily understandable.
Price doesn't need to go higher you have a double top and indi wave is lower.
Its also worth mentioning the subtlety between counter trend divergence and (my preference) divergence after a CT pullback signalling a move back into trend.
Read the perfectly clear instructions within the indicator, highlighted in GREEN
Enter 1440 in the Timeframe section as shown by arrow, and this will "freeze" or set the indicator to read as Daily no matter which timeframe you change to.
Remember this for other indicator; a basic knowledge of TIME is required to trade: 60 minutes in 1 hour, 24 hour in a day.
Hello all. I am finally getting back to trading after a 2 month break. I was away on contract and could not access any trading platform. In that time away i was able to access last years charts in another mt4 platform. I inserted X-Mans template and spent about 1 1/2 hours back testing every night after work. Also I read Mark Douglas " Trading in the Zone", and not only kept up with this thread but have gone through most of the TMS thread as well.
Today is the first day i have looked at a live chart in 2 months and the difference is amazing. I know exactly what i am looking for, not bothered by not seeing any trading set ups, and thinking i need to jump into a trade because i see price move a few pips one way or the other. Not sure how i will do this week on demo but feel more relaxed and confident than i can ever remember about trading. Thanks to X-Man and all the active members on here that make the thread such a great place to learn!
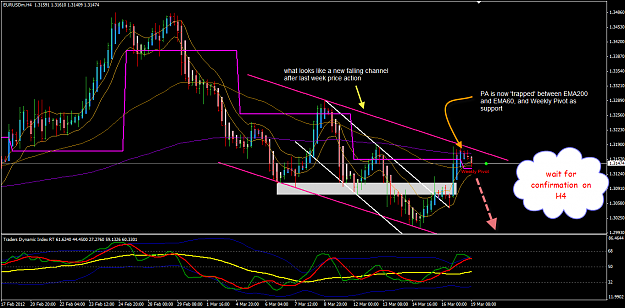
Hi,
After last Friday' surprise bullish rally, what looks like is a new channel has been establish for downflow.
However, if price break above this new channel, it will test the previous week 10 high.
But this week's pivot 1.3136 may play as support until I see a convincing break below.
Good Trading!
Attached Image (click to enlarge)
Honesty is a very expensive gift. You wont find it in cheap people.WBuffett
Hi,
After last Friday' surprise bullish rally, what looks like is a new channel has been establish for downflow.
However, if price break above this new channel, it will test the previous week 10 high.
But this week's pivot 1.3136 may play as support until I see a convincing break below.
Good Trading!
Ignored
Good day to you my friend, yes I'm a bit concerned about breaking the DPV, aside from that, the WPV is just a few pips below DPV...the 200EMA is also almost coinciding with the DPV...
My only driver though to go short is the TDI cross on H1 & H4 which seems to support each other plus the break of the asian range.....also the NZDUSD is favoring the downside with a good cross on the TDI too..
nothing so far with today's calendar that would suggest an upward shoot...
In GOD We TRUST !!!
"REPETITION is the mother of all SKILLS." -Bo Sanchez