DislikedHey man, great work on this thread. Just noticed this great looking indicator here on this chart - the yellow lines, not the volume.
Assuming its based on planetary cycles or something..
Could you tell me what it is and where exactly I could find it?
Thanx, appreciate it.Ignored
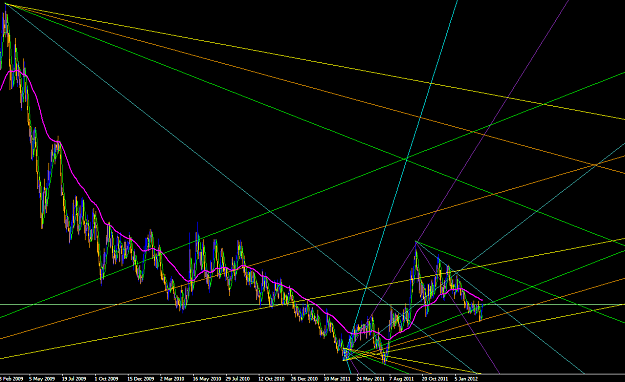
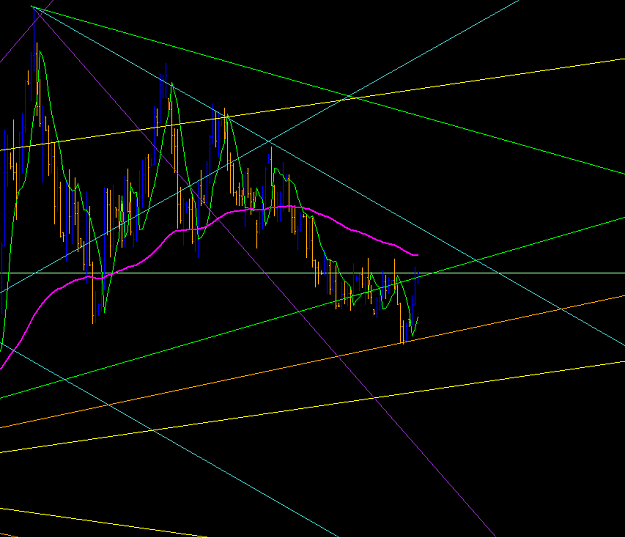
It basically figures cycles for a determined length upto 6 different cycles depending on the length of history it cycles default is 1000 bars BUT if u input 5000 bars the cycles become small to large to very large.
Rusky built and built well, found it cruising around. You can after you build the cycles just run some cycle lines as desired top/top bottom/bottom top/bottom ETC maybe even cycles inbetween the T/T B/B whatever u find a fit for desired asset. Good Luck
If that is what you were refering to
Attached File(s)
"Millionaires don't use astrology, billionaires do"