Having small sub accounts that limit Alfredo's loss to 4% of his trading capital is how he manages his risk. He say's that is how the big players keep the bulk of their capital segregated from excessive loss. For us mere mortals we just use a stop loss. It is not an integral part of the system.
William
Ignored
Ha! Yeah put me in the mere mortal line, the long one!
Blocked the background of the grid, so the candles don't get in the way.
Buy means price is below the band. Sell, above.
Green Buy/Sell, means the TMA trend is up.
Red Buy/Sell, means the TMA trend is down.
As someone has found out... if a program you have installed has modified the system fonts, the grid will not show up properly. I am using the "Ariel" and "Webdings" system fonts.
I have removed the Monthly and Weekly timeframes per Al.
Carl
Ignored
Great work!
Would it be possible to monitor more than 8 pairs? That would be very nice.
What I just told you in the past 30 minutes will make you a lot of money in your Forex trading life if you make it a habit to scan all the pairs until it becomes second nature. Never allow yourself to become fixated on one pair. Like a pilot in the clouds, you have to constantly scan all the instruments. Getting fixated on only one can spell death.
Ignored
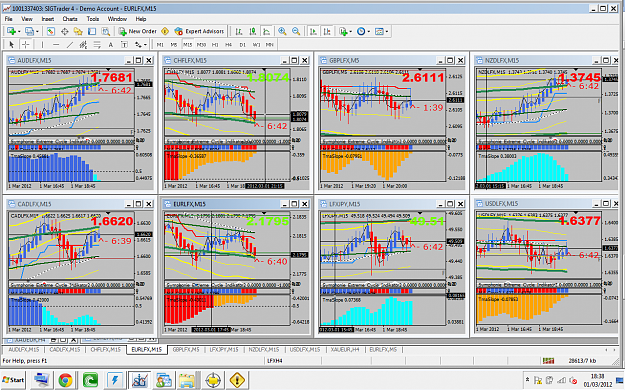
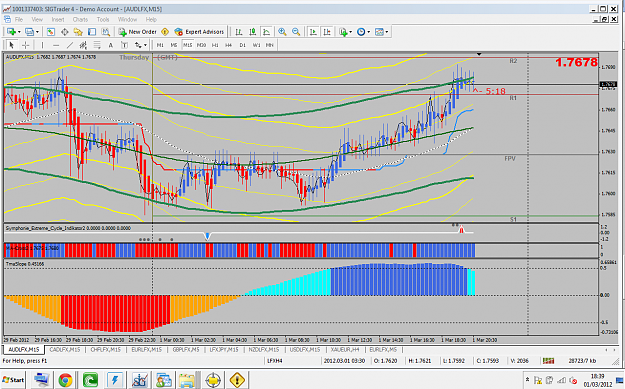
I want to show you my idea 4 scanning the market and see force/weakness of currencies. I remember that someone mentioned this broker (SIGTRADER) that has these indexes created with correlation between the 8 most common currencies. I applied to them the TMA template (as I adjusted 4 me TMA bands are the thick green ones)
I attache two pics for example
Hope it can help
Notice that LFXJPY (only) is the index of other 7 currencies against JPY so: LFXJPY STRONG JPY WEAK and so on...
Enhorabuena Alfredo por tu sistema es de lo mejorcito que he visto. Sigue así y muchisimas gracias por compartirlo con todos nosotros. Lo único que siento es no poder aportar nada debido a mi poca experiencia como trader pero desde aquí darte las gracias por tu aporte desinteresado.
Blocked the background of the grid, so the candles don't get in the way.
Buy means price is below the band. Sell, above.
Green Buy/Sell, means the TMA trend is up.
Red Buy/Sell, means the TMA trend is down.
As someone has found out... if a program you have installed has modified the system fonts, the grid will not show up properly. I am using the "Ariel" and "Webdings" system fonts.
I have removed the Monthly and Weekly timeframes per Al.
Carl
Ignored
Carl, it was me that had the sizing problem with your last version of the dashboard.
I have never knowingly changed the font on this PC which is less than a year old.
I expected the same problem with this one and was going to post a question on a computer help forum for dummies (me) about how to get Ariel as my default so that I could view the v6 properly but the v6 is showing everything perfectly except the white top row, and I can live with that.
I want to show you my idea 4 scanning the market and see force/weakness of currencies. I remember that someone mentioned this broker (SIGTRADER) that has these indexes created with correlation between the 8 most common currencies. I applied to them the TMA template (as I adjusted 4 me TMA bands are the thick green ones)
I attache two pics for example
Hope it can help
Notice that LFXJPY (only) is the index of other 7 currencies against JPY so: LFXJPY STRONG JPY WEAK and so on...
Ignored
No need to change your broker !
I have the indicator which shows exactly what sigtrader does and you can drp it on your charts on any broker
I have studied this thread and looking behind the scenes. Alfredo, I would like to congratulate you for the excellent system and all those who are contributing for the improvement. Shahrooz, Great job with the TMA Slope indicator.
Bye
Ignored
Thanks, ForexGirl.
I hope it is making pips for you. Let me know if I can help you with anything.
That is a good suggestion. We will work on it and If it looks like it will be of help, we will change it on version 1.4 which will probably include voice alarms also. Yes, you can turn them off if you so desire, I can imagine me with 18 charts and getting 18 female voices: "Slope is down, slope is up..."
Ignored
Actually, I think it needs to be a combination of both. It needs to show at a glance the bias AND the slope. What I would ideally like to see is this:
1. Graph displayed as it is now, but with these colours:
0 to +0.5 = subtle, dark green
Above 0.5 = bright lime green
0 to -0.5 = dark red
Below -0.5 = bright red
That will easily show the trading bias and give a heads-up whether it's a strong or weak trend.
2. A large arrow painted next to the numbers to show the slope. So, it would point up if the graph is rising and vice versa.
So for a short trade, you just have to look for red (dark or bright), a down arrow and the price above the top line + near a resistance level.
Also, I think it would be a good idea to add an indicator to the default set to show big round numbers (1.3300, 1.3400 etc.) Price very often makes a U-turn when it hits one, so they are are at least as valid as the pivots, especially if you're trading M1 or M5. Can anyone suggest a good indicator for this?
If I'm not mistaken, one of the key features needed to make this work is the ability to move money from one account to the other. I spoke with Oanda some time ago about this and they did not have an easy solution for moving money between the accounts. Is this still the case?
Greg
Ignored
With FxPro that is a simple matter. I think Oanda does it too.
Also, I think it would be a good idea to add an indicator to the default set to show big round numbers (1.3300, 1.3400 etc.) Price very often makes a U-turn when it hits one, so they are are at least as valid as the pivots, especially if you're trading M1 or M5. Can anyone suggest a good indicator for this?
That in italian sounds:" better an egg now than a chicken tomorrow"
Well...starting now to read the new 20 pages I missed since this mornig...let's see whats happened
Al,
by the way, .....i read this morning you were suggesting to another of us that like me has only few hours 4 trading to refer to H1 timeframe. Do you exclude the H4 timeframe ? Or would it be too suitable 4 me under certain conditions ?
(I usually can attend trading all day on monday only- a flat day usually sigh- and I'm off in the other days from 9 am to 4 pm gmt.)
Sorry...
Ignored
Corvo,
H4 will work just as well, if you have the patience for it.
if the price action is hovering around the central Blue TMA line this means that we are waiting for price action to move upto the outer bands so we csan go long/short?
Also what do the green arrows mean please?
Thanks again!
Ignored
1- Yes.
2- The Green arrows indicate the first bar where the Slope is increasing as compared to the previous bar.
Having small sub accounts that limit Alfredo's loss to 4% of his trading capital is how he manages his risk. He say's that is how the big players keep the bulk of their capital segregated from excessive loss. For us mere mortals we just use a stop loss. It is not an integral part of the system.
William
Ignored
Thanks for the help, William.
Watch out or I´ll end up recruiting you to help me run this thing.