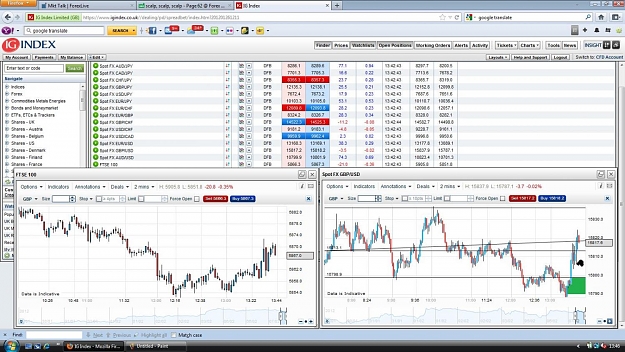
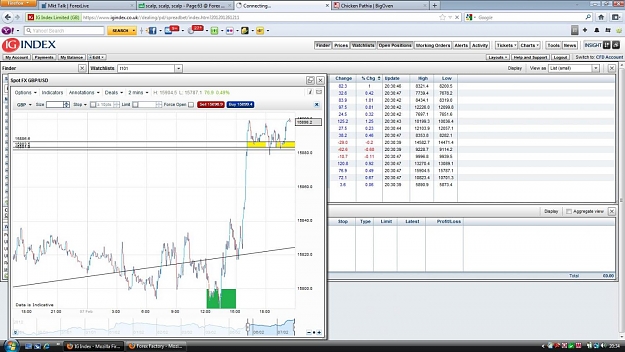
Dislikedhi jonas,heres my chart of ft100,daily,this is the level i placed my stop from,it looks like i may be stopped out on this trade,you can see its at the bottom of the previous sell zone,if i am stopped out the diaganal just above will be my position to look for my short with a longer term view,although 5680 being the initial target ,but altimatly a drop to 5100 is my longer term forcast,i said some weeks ago about shorting to this level and it was still to early in its cycle,again were not there yet but the diaginal will be a good area to atleast...Ignored
I have already blown 1 account by trying to trade without S/L. So until I find a strategy which works for me, I am on demo account. The previous sell zone lines, are they previous support/ resistance levels?
Yonas