Yesterday I posted a chart of gold. I called where the current price was a point of reflection. Price threatened to downtrend line and has since retreated today.
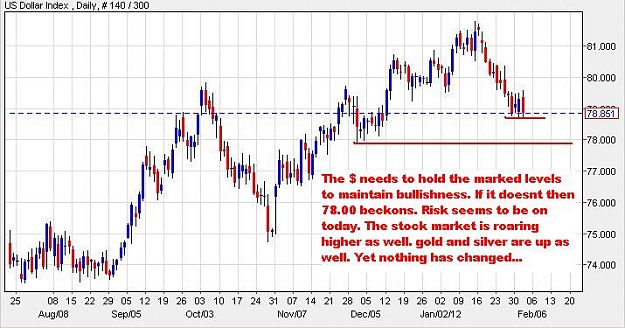
By the way, if gold is a safety net how come it is going down with the stock market it is supposed to save us from
Today I post a daily chart of silver. We have the 100sma on the chart - the blue line. We also have previous support/resistance on the chart - the red line.
We have an overbought stochastics which is turning. Last but not the least we have a spinning top candle pattern.
I am bearish. We have had a deep retracement of the fall and I am looking for a turn downwards. Do your own d/d. If we take out the highs of the spinning top then all bets are off like we did in the eurcad
Olu
Attached Image (click to enlarge)

If you think you can or cannot do it you are correct