• Home
  • Forums
  • Trades
  • News
  • Calendar
  • Market
  • Brokers
  • Login
  • Join
  • User/Email: Password:
  • 1:33pm
Menu
  • Forums
  • Trades
  • News
  • Calendar
  • Market
  • Brokers
  • Login
  • Join
  • 1:33pm
Sister Sites
  • Metals Mine
  • Energy EXCH
  • Crypto Craft

Options

Bookmark Thread

First Page First Unread Last Page Last Post

Print Thread

Similar Threads

Super Simple System for Scalping 177 replies

Super Simple System 314 replies

Another great Breakout GBP/JPY System (Dachel's Simple system) 62 replies

Please suggest a simple & effective Method/System of "Trading System" Forum to newbie 176 replies

X-Man's super simple system 4 hour method 1 reply

  • Commercial Content
  • /
  • Reply to Thread
  • Subscribe
  • 2,890
Attachments: X-Man's Super Simple System
Exit Attachments
Tags: X-Man's Super Simple System
Cancel

X-Man's Super Simple System

  • Last Post
  •  
  • 1 158159Page 160161162 559
  • 1 Page 160 559
  •  
  • Post #3,181
  • Quote
  • Jan 26, 2012 8:11am Jan 26, 2012 8:11am
  •  geoffl
  • | Joined May 2011 | Status: Member | 31 Posts
Quoting Steve 56
Disliked
Geoffl not trying to be Critical but your heading down a Slippery Slope in Trading, as it seems you have no Structure or Trading Plan. You stated that "Again not a Recommended Strategy and certainly nothing to do with this system, or Tech Analysis". Tweaking a great method like X-Mans is fine but Gut feeling is I have found more often to be "Wonderful with Experience, but was a Disaster waiting to happen with Hindsight". Good Luck


9 Years and Still Learning
Ignored
Thanks, and no offence taken. I often chide myself for making such rash decisions, it has more often gone wrong than right!

I wasn't completely without TA on this decision, I had a SL and a Limit Order set based on previous supports and resistances, the only bit where I strayed was executing the trade without a clear signal, I always trade with the trend, which in this case, is still up, hence my decision to go long.

The next few hours will be interesting, will the USD continue to weaken? The daily chart shows a bullish candle yesterday, I would hesitate to go against that at the moment.
 
 
  • Post #3,182
  • Quote
  • Jan 26, 2012 8:11am Jan 26, 2012 8:11am
  •  X-Man
  • | Commercial Member | Joined Aug 2011 | 2,409 Posts
"there are pro traders out there that have more knowledge than you, more resources than you and better systems than you. They rely on the fact that you are unprepared, undisciplined and afraid. Do not think for one minute they don’t know this. In fact, they are counting on it. Ultimately you will be consistently making money or consistently making excuses. How do we know this? That used to be us."

Dcginc (Rick)

X-man the legendary conqueror of markets
 
 
  • Post #3,183
  • Quote
  • Jan 26, 2012 8:26am Jan 26, 2012 8:26am
  •  Steve 56
  • | Joined Dec 2011 | Status: Member | 53 Posts
"Never a Truer Word said"


9 Years and Still learning
 
 
  • Post #3,184
  • Quote
  • Jan 26, 2012 12:04pm Jan 26, 2012 12:04pm
  •  Quezoy
  • | Joined Nov 2011 | Status: Member | 1,078 Posts
Would this be a 4H setup to short?
http://shrani.si/t/X/eq/3urWRIpU/1.jpg

I'm new to this method, just started readin about it, but I've noticed this setup doing that so...
Thoughts are things
 
 
  • Post #3,185
  • Quote
  • Jan 26, 2012 12:24pm Jan 26, 2012 12:24pm
  •  SuperNoobie
  • | Joined Nov 2011 | Status: Member | 31 Posts
Quoting Quezoy
Disliked
Would this be a 4H setup to short?
http://shrani.si/t/X/eq/3urWRIpU/1.jpg

I'm new to this method, just started readin about it, but I've noticed this setup doing that so...
Ignored
According to X'man's system, the TDI has to break the blue bands first. In the picture, TDI didnt break. Secondly, the candle colour has to change colour, showing the change in direction. Thirdly, it has to be below the EMA purple line. And lastly TDI signal crosses. If all are fulfilled, this is the ideal set-ups.
 
 
  • Post #3,186
  • Quote
  • Jan 26, 2012 12:44pm Jan 26, 2012 12:44pm
  •  thrax
  • | Joined Sep 2011 | Status: Member | 180 Posts
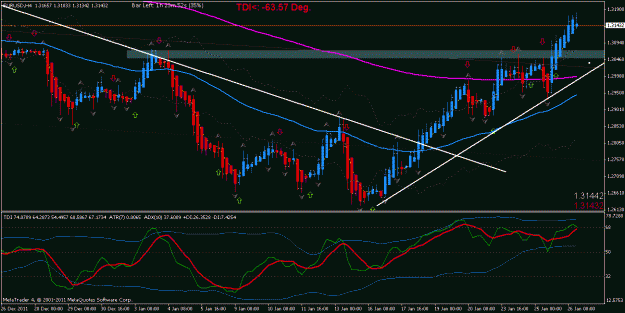
I would wait right now, because we are above EMA(60) and EMA(200) (magenta line). We crossed the former resistance area (dark gray rectangle) so it became support right now. The white lines are the trendline of the dailiy TF.
So I will wait the price to retrace to this support area and bounce off and then I would enter long. But this is just my personal assessement.
thrax
Attached Image (click to enlarge)
Click to Enlarge

Name: EURUSD_H4_strategy name_20120126183609.gif
Size: 26 KB
 
 
  • Post #3,187
  • Quote
  • Jan 26, 2012 1:32pm Jan 26, 2012 1:32pm
  •  hale-mary
  • | Joined Nov 2011 | Status: Member | 271 Posts
Quoting Steve 56
Disliked
Hi I consider myself fortunate today, as I could easily have lost 30 Pips.
There had been support all day around 130.90 Level. Thats why I put entry just under. If I wasnt scalping I would of needed to Close under Support. On those MISS trades, I have shown you where I would of Entered, for perusal, but it was around 5am my time. I was asleep well and truly.
Forexsaurus, dont beat yourself up it will only take you longer to overcome the psychological aspects that every trader has to overcome. This at least might help visually. Compress the Chart...
Ignored
Steve can you explain this inside bar and outside bar confirmation. (i think you are using the synergy candles, but not sure.) I never really understood what gives some one a heads up with those bars. it might help with backtesting
 
 
  • Post #3,188
  • Quote
  • Jan 26, 2012 3:40pm Jan 26, 2012 3:40pm
  •  Quezoy
  • | Joined Nov 2011 | Status: Member | 1,078 Posts
Quoting SuperNoobie
Disliked
According to X'man's system, the TDI has to break the blue bands first. In the picture, TDI didnt break. Secondly, the candle colour has to change colour, showing the change in direction. Thirdly, it has to be below the EMA purple line. And lastly TDI signal crosses. If all are fulfilled, this is the ideal set-ups.
Ignored
True, TDI didnt break and candle didnt change colour (now it did allready).

About being below the EMA... I guess this depends on the situation. In this case we had a break to the upside not long ago and now the price has to retrace somewhere. And a good point fot that would be the SHI resistance.
TDI also didnt cross then (it did now), but it was sloping down.
I'd love if someone could clarify this point for me.

Tnx for the explanation, seems I got lucky in my first attempt, as the gain is 50 pips ATM.
Thoughts are things
 
 
  • Post #3,189
  • Quote
  • Jan 26, 2012 7:27pm Jan 26, 2012 7:27pm
  •  Steve 56
  • | Joined Dec 2011 | Status: Member | 53 Posts
Quoting hale-mary
Disliked
Steve can you explain this inside bar and outside bar confirmation. (i think you are using the synergy candles, but not sure.) I never really understood what gives some one a heads up with those bars. it might help with backtesting
Ignored
Hi Hale -Mary, I like to keep things as simple as possible, Thats why I like X-Mans method. Firstly on my charts, yes they are Synergy, the Charts are just Compressed. You cannot just take any reversal Bar, we all know that. So if I dont see a Classic Bar Reversal {Pin Bars with Long Wicks}. I look for Reversal Bars with further Confirmation. In my case I look to see if PA is drying up ala Hooks and space and then I wait for a Reversal Candle. As reversals dont always take off immediately I am content if it is followed by an Inside or Outside Candle coming off Support or Resistance or breaking it by closing Ab/Bel. And in my experience Supp/Res comes only second to PA. So it Confirms my interpretation especially if TDI confirms as well. I use 15 min and 1 hr Time Frames and as X-Man has graciously given us 2 methods, I look at 4hr and Daily Templates for direction. I will Fib large Pin bar candles for better Entries, but make no mistake I miss a lot of Breakout moves when Price takes off on some of the bigger Reversal Candles. Thats the price I pay for my tweaking of the Method, whereas Phx62 usually catches them as he uses Breaks of Highs and Lows from different Sessions, Previous Day Etc. By the way I believe we are around the same age, my kids have left home as well but I believe I have more time on my hands to answer questions Posts etc LOL. In trading I would be considered a grinder, whereas Phx62 is a craftsman. X-Man Talks the Talk and Walks the Walk and for someone so inexperienced he is Extraordinary. Phx62 and I are different in some ways but committed to the Basics of X-Mans Method. As we are all different you just need to find what suits your Trading Style. Mine is keep it simple, Backtest, Backtest,and Backtest, Go back over old Posts from Big E, X-Man, DgCinc, Phx62, and SmokeyD,and I might add Lazy Lobster, and many others. Just keeps your eye on the ball so to speak. You stated your having a better week, are you doing anything different, are your Entries Better, Stops Tighter, Profits Greater. Anything you write down do it in a positive light. And maybe soon you will have the Confidence of X-Man. "The Enemy in Forex is not your Fellow Trader or your Broker its the Beast Within".

9 Years and Still Learning
 
 
  • Post #3,190
  • Quote
  • Jan 26, 2012 9:45pm Jan 26, 2012 9:45pm
  •  Steve 56
  • | Joined Dec 2011 | Status: Member | 53 Posts
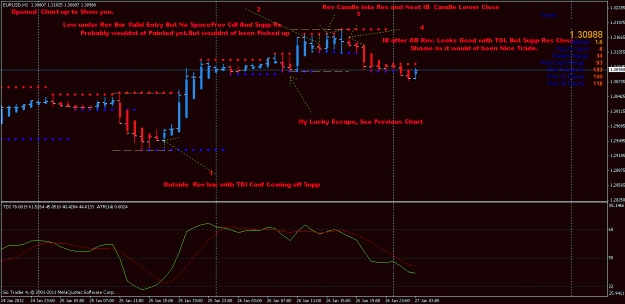
Hi Hale-Mary, See attached Charts with Visual IB and OB signals. The important thing is you still need a Rev candle Conf to Enter a Trade. I have shown you Micromanaged trades per Candle on Expanded Chart . You tell me. I think last night was Crap for about 8 hours and yet if you looked closely and tried to interpret every bar in a Range you may see Trades and signals that would probably have whipsawed you and sent you Nuts at the same time. How much clearer were previous days action with Charts that I consider easy to see.
Patience is a real Virtue in trading, but we struggle to cope with it, myself included. Scenario 1/ How many inexperienced Traders out there are willing to wait for what I call X-Mans Classic reversal. Pin Bars with large Wicks and Open/Close at one end of the Candle, and know that if you just traded those set ups, that by the end of Feb you can say to your Partner/Family I am finally showing a profit. You would be surprised how often they pop up. Scenario 2/ Can you say I have backtested enough to finally say I am getting it and I am going to Trade on Micro A/C and see if I am improving or am I missing something, or realise this particular Method is not for me, or even if Trading is not for me. If your passionate enough and willing to do the required work and learn from your Mistakes then Scenario 2 is not even an Option. X-Man has given you the Foundation, the rest is up to you.


9 years and Still Learning
Attached Image(s) (click to enlarge)
Click to Enlarge

Name: eur1.gif
Size: 22 KB
Click to Enlarge

Name: eur 2.gif
Size: 25 KB
 
 
  • Post #3,191
  • Quote
  • Jan 27, 2012 1:34am Jan 27, 2012 1:34am
  •  robuk
  • | Joined Nov 2011 | Status: Member | 465 Posts
i just looked at eu 1hr bar chart and zoom out , looks to me like perfect head and shoulders ?
am i right ?
trying to learn
ROB
 
 
  • Post #3,192
  • Quote
  • Jan 27, 2012 3:30am Jan 27, 2012 3:30am
  •  emmanuel7788
  • Joined Nov 2008 | Status: Member | 40,217 Posts
Quoting robuk
Disliked
i just looked at eu 1hr bar chart and zoom out , looks to me like perfect head and shoulders ?
am i right ?
trying to learn
ROB
Ignored

I don't know what head and shoulders mean in H1 charts, but I always see spikes all over ....so I don't go near them.
Attached Image
Honesty is a very expensive gift. You wont find it in cheap people.WBuffett
 
 
  • Post #3,193
  • Quote
  • Jan 27, 2012 3:34am Jan 27, 2012 3:34am
  •  emmanuel7788
  • Joined Nov 2008 | Status: Member | 40,217 Posts
Right now, looks like no strong buyers and sellers willing to make their move. Trap between two lines...
1.3120 is dailiy pivot
1.3065 is weekly R1

Do you want to be buyer or seller?
Honesty is a very expensive gift. You wont find it in cheap people.WBuffett
 
 
  • Post #3,194
  • Quote
  • Jan 27, 2012 6:51am Jan 27, 2012 6:51am
  •  robthorp
  • | Commercial Member | Joined Oct 2011 | 131 Posts
Slightly off topic and probably a really stupid question, but what causes the gap between the close of one bar, and the open of the next?
Logically you would think the close of the 1st bar would be the open of the next bar.
Attached Image
 
 
  • Post #3,195
  • Quote
  • Jan 27, 2012 7:32am Jan 27, 2012 7:32am
  •  niktrad
  • | Joined May 2010 | Status: Member | 35 Posts
Quoting robthorp
Disliked
Slightly off topic and probably a really stupid question, but what causes the gap between the close of one bar, and the open of the next?
Logically you would think the close of the 1st bar would be the open of the next bar.
Ignored
Hi Robthorp, These are average price bars so the open of one bar is the average of the open and close of the previous one
 
 
  • Post #3,196
  • Quote
  • Jan 27, 2012 8:03am Jan 27, 2012 8:03am
  •  SuperNoobie
  • | Joined Nov 2011 | Status: Member | 31 Posts
Quoting robthorp
Disliked
Slightly off topic and probably a really stupid question, but what causes the gap between the close of one bar, and the open of the next?
Logically you would think the close of the 1st bar would be the open of the next bar.
Ignored
The gap area isn't necessarily explored during the hour. It's just to show the strength of the bar for that certain period, Synergy bars.
 
 
  • Post #3,197
  • Quote
  • Jan 27, 2012 8:11am Jan 27, 2012 8:11am
  •  robthorp
  • | Commercial Member | Joined Oct 2011 | 131 Posts
Thanks for answer supernoobie, so in the diagram i attatched, theoretically if i entered on the bar with white arrows on, as it had no lower wick, i could have entered immediatley as it open with a stoploss of 5 pips?
Not saying i would have done that, but just for my backtestings sake.
Thanks, Rob
 
 
  • Post #3,198
  • Quote
  • Jan 27, 2012 8:25am Jan 27, 2012 8:25am
  •  emmanuel7788
  • Joined Nov 2008 | Status: Member | 40,217 Posts
Quoting robthorp
Disliked
Slightly off topic and probably a really stupid question, but what causes the gap between the close of one bar, and the open of the next?
Logically you would think the close of the 1st bar would be the open of the next bar.
Ignored
Hi Rob,
You have an inquistive mind. That's good for a young man to gain knowledge.

The 'open-close gap' you see on the Syngergy APB is different from the price gap on the actual price bar/candle.
In forex, price gaps are not common but you see them on higher timeframes over the weekend when market closed and re-open. On very low timeframes like M1, gaps can be very noticeable. Price gaps means widen spread between Bid and Ask. There maybe a variety of reasons for the price gaps. Could be from the bank data feed to the brokers. If you used broker ibfx, there is s server re-initialization at GMT 2300, interruption of 3 mins. The next candle opens at GMT2303. This often result in price gaps.

The Synergy APB is another version of the Heiken Ashi (HA) but with some proprietary calculations.
The HA open price is not the actual open price but is the average of the last bar open and close prices.
See below:
> HAOpen = (open of previous bar+close of previous bar)/2
> HAClose = (open+high+low+close)/4
This will explain why the 'open/close gap' in the Synergy APB.
Good to know, but when we use the APB to trade X-Man S3 method, we only see the strength and momentum of each price bar.

Enjoy the learning!
Honesty is a very expensive gift. You wont find it in cheap people.WBuffett
 
 
  • Post #3,199
  • Quote
  • Jan 27, 2012 8:47am Jan 27, 2012 8:47am
  •  emmanuel7788
  • Joined Nov 2008 | Status: Member | 40,217 Posts
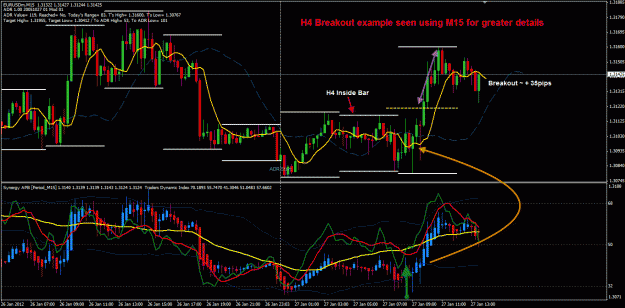
Hi,

Attached example of another H4 Inside Bar breakout trade which yielded +35pips.
Not easy to pick this trade as the Dailiy Pivot 1.3120 was resistance during the Asian session. This was tested twice. Need to see price momentum to break this level. The APb did the work on M15.
Below the Asian session was this week resistance truned support and also the weekly R1 1.3065.
There wasn't much room above to consider especially when the previous day closed 1.3183 and also a bearish Hammer was threathening.
Attached Image (click to enlarge)
Click to Enlarge

Name: EURUSD M15 H4 Inside Bar breakout 27-1-2012 9-32-44 PM.gif
Size: 44 KB
Honesty is a very expensive gift. You wont find it in cheap people.WBuffett
 
 
  • Post #3,200
  • Quote
  • Jan 27, 2012 9:39am Jan 27, 2012 9:39am
  •  firsttimer
  • | Joined Oct 2011 | Status: Member | 431 Posts
would u guys have short at open after the 2nd last red candle?

reason for short:

1. TDI green below red.
2. TDI going below 50.
3. Price bar close below 5ema low.

reason not to short:
1. Price still above 60ema which acts as previous resistance.

give me some views.

Thanks.

[IMG]http://img585.imageshack.us/img585/4738/setup1.gif

Uploaded with ImageShack.us[/IMG]
 
 
  • Commercial Content
  • /
  • X-Man's Super Simple System
  • Reply to Thread
    • 1 158159Page 160161162 559
    • 1 Page 160 559
0 traders viewing now
  • More
Top of Page
  • Facebook
  • Twitter
About FF
  • Mission
  • Products
  • User Guide
  • Media Kit
  • Blog
  • Contact
FF Products
  • Forums
  • Trades
  • Calendar
  • News
  • Market
  • Brokers
  • Trade Explorer
FF Website
  • Homepage
  • Search
  • Members
  • Report a Bug
Follow FF
  • Facebook
  • Twitter

FF Sister Sites:

  • Metals Mine
  • Energy EXCH
  • Crypto Craft

Forex Factory® is a brand of Fair Economy, Inc.

Terms of Service / ©2023