• Home
  • Forums
  • Trades
  • News
  • Calendar
  • Market
  • Brokers
  • Login
  • Join
  • User/Email: Password:
  • 7:40am
Menu
  • Forums
  • Trades
  • News
  • Calendar
  • Market
  • Brokers
  • Login
  • Join
  • 7:40am
Sister Sites
  • Metals Mine
  • Energy EXCH
  • Crypto Craft

Options

Bookmark Thread

First Page First Unread Last Page Last Post

Print Thread

Similar Threads

Super Simple System for Scalping 177 replies

Super Simple System 314 replies

Another great Breakout GBP/JPY System (Dachel's Simple system) 62 replies

Please suggest a simple & effective Method/System of "Trading System" Forum to newbie 176 replies

X-Man's super simple system 4 hour method 1 reply

  • Commercial Content
  • /
  • Reply to Thread
  • Subscribe
  • 2,890
Attachments: X-Man's Super Simple System
Exit Attachments
Tags: X-Man's Super Simple System
Cancel

X-Man's Super Simple System

  • Last Post
  •  
  • 1 147148Page 149150151 559
  • 1 Page 149 559
  •  
  • Post #2,961
  • Quote
  • Edited 4:10pm Jan 19, 2012 3:37pm | Edited 4:10pm
  •  Phiksalamuk
  • | Joined Feb 2011 | Status: Member | 188 Posts
Long on AUDCAD. PA bounced from SMA and TDI was returning from outside blue band. TP is top of SHI Channel.
Attached Image (click to enlarge)
Click to Enlarge

Name: audcad.gif
Size: 26 KB
 
 
  • Post #2,962
  • Quote
  • Jan 19, 2012 4:20pm Jan 19, 2012 4:20pm
  •  smash85
  • | Joined Sep 2011 | Status: Member | 123 Posts
Quoting Phiksalamuk
Disliked
Long on AUDCAD. PA bounced from SMA and TDI was returning from outside blue band. TP is top of SHI Channel.
Ignored
A+++ signal,... hope it pays off!
 
 
  • Post #2,963
  • Quote
  • Jan 19, 2012 4:42pm Jan 19, 2012 4:42pm
  •  EaglePip
  • | Joined Jan 2011 | Status: Dormant | 407 Posts
For those watching E/U 4H, could it be that we are seeing a repeat of Oct, seen more clearly on the Daily. It appears that price had strayed too far from the 60ema.
EP
Attached Image (click to enlarge)
Click to Enlarge

Name: jan19.gif
Size: 39 KB
 
 
  • Post #2,964
  • Quote
  • Jan 19, 2012 5:54pm Jan 19, 2012 5:54pm
  •  Phiksalamuk
  • | Joined Feb 2011 | Status: Member | 188 Posts
Quoting smash85
Disliked
A+++ signal,... hope it pays off!
Ignored
Hope so...! Gonna have some sleep now. SL put breakeven. Will let it work tonight....
 
 
  • Post #2,965
  • Quote
  • Jan 19, 2012 6:25pm Jan 19, 2012 6:25pm
  •  tonny47
  • Joined Apr 2008 | Status: Member | 1,312 Posts
Quoting X-Man
Disliked
Tonny my buddy
Both the first candles in both pictures are totally different.
First we must realize that the open of a candle is on the left hand side and the close of the candle happens on the right hand side.

In the first picture the open was high and the closed formed below the open.
The second picture the open was low the the close formed above the open.
[size=3][color=blue]Does...
Ignored
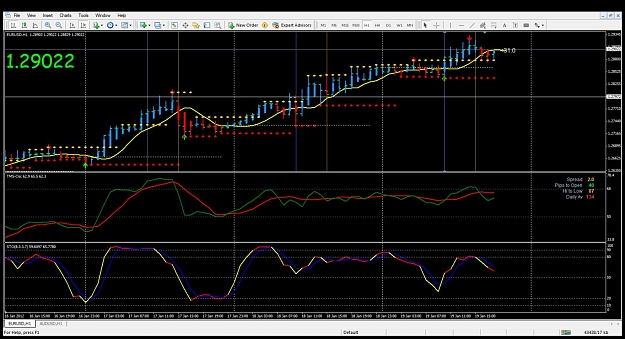
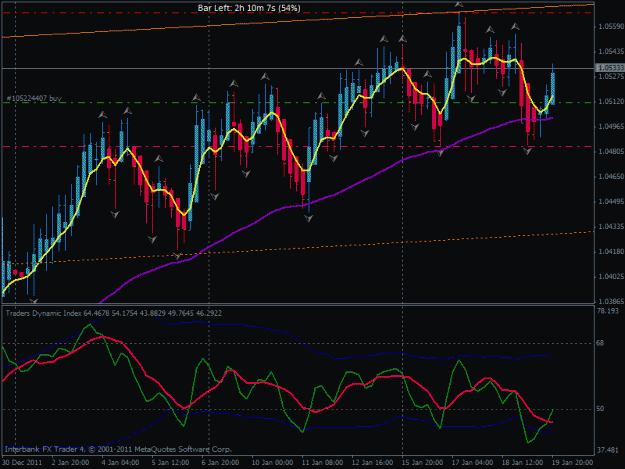
hi X-man,

sorry to disagree, i suppose you just didnt look properly but its the other way around. I only looked at the first candle at each picture.The first candle on first picture closed above its open and the opposite for the second picture.
what i was trying to say is that to me it seems like exactly the same circumstances
in a first picture, it was a red candle which closed higher in a downtrend (below the yellow moving average) and you said its no trade. in second picture, there was a blue candle in an uptrend (above the yellow moving average) which closed lower and you said its a good selling opportunity. it seems to me as the exact opposite as the first one, so i dont understand why you didnt go long on the first one.

I apologise for the long message but i am really trying to understand it but honestly not sure what i am missing here.

all the best

tonny
 
 
  • Post #2,966
  • Quote
  • Jan 19, 2012 6:41pm Jan 19, 2012 6:41pm
  •  emmanuel7788
  • Joined Nov 2008 | Status: Member | 40,253 Posts
[quote=hale-mary;5310481]emmanuel, those candlestick patterns you posted a while back. How do you determine the length of time they are valid.

h-m,

in the case of inside bars, these show narrow trading range, so I look for breakout of the inside bar(s). If the preceding candles are trending with HH, HL, order and comes a Inside Bar, the breakout trade should be taken at the next H4 candle time. We are talking about H4 candles, so there is a 4-hours duration , but most often a good entry in in the following 1-2 H1 candles.
In yesterday example, the IB is followup by a larger Outside Bar (OB) which has a wider range. Notice the retracement of this OB! it is 50%. That is another opportunity to make an entry.
Note that all these times, the APB(H1) is telling you something.

If you see a series of small H4 bars, and sometimes double inside bars in consecutively, these are higher probability trade entries.

I don't recommned newbie trade S3 method on M15 until they are fluent with the H1 TF, but for the purpose to learn PA and price behaviour, look at M15 chart with the H4 High-Low lines. You will see a lot more details and learn quicker.
You should learn to see in M15 the price momentum, where the thrust is and the pullbacks/retracement after each thrust. You see also the narrow range consolidations usually after a series of HH,HL or (LH,LL), and also the 123 setups much better.
Always be mindful where the key Support and Resistance levels are.

Have lots of patience when you trade. You will enjoy that.
Honesty is a very expensive gift. You wont find it in cheap people.WBuffett
 
 
  • Post #2,967
  • Quote
  • Jan 19, 2012 7:43pm Jan 19, 2012 7:43pm
  •  Steve 56
  • | Joined Dec 2011 | Status: Member | 53 Posts
Hi Hale Mary, On what was a poor day re the system you should pat yourself on the back. You took a reversal candle, not a classic one but breakout of Support, [Fractals or SuppRes Barry great for that]. Agree with emmanuel7788 re better price. I Fib large candles to get better entry and Stop Loss, but that is my trading plan. Anyway you broke even, consider that a win in your learning curve with this system. And dont beat yourself up when you lose, its the price we pay to be part of the market. You will get better,and I do admire your persistence
 
 
  • Post #2,968
  • Quote
  • Jan 19, 2012 9:40pm Jan 19, 2012 9:40pm
  •  hale-mary
  • | Joined Nov 2011 | Status: Member | 271 Posts
Quoting Steve 56
Disliked
Hi Hale Mary, On what was a poor day re the system you should pat yourself on the back. You took a reversal candle, not a classic one but breakout of Support, [Fractals or SuppRes Barry great for that]. Agree with emmanuel7788 re better price. I Fib large candles to get better entry and Stop Loss, but that is my trading plan. Anyway you broke even, consider that a win in your learning curve with this system. And dont beat yourself up when you lose, its the price we pay to be part of the market. You will get better,and I do admire your persistence...
Ignored
what do you consider a CLASSICAL reversal candle. thanks for the encouragement.
 
 
  • Post #2,969
  • Quote
  • Jan 19, 2012 11:07pm Jan 19, 2012 11:07pm
  •  Steve 56
  • | Joined Dec 2011 | Status: Member | 53 Posts
Hi HM, My interpretation would be in an uptrend a large Pin Candle/Shooting Star with Open/Close within the body or close to it with large upper wick, preferably RED but would still take Blue. With no obvious support underneath, IE Round Number/Previous support. Opposite for Downtrend look for Pin/Hammer/Hanging Man. Will take it every time!!
Steve
 
 
  • Post #2,970
  • Quote
  • Jan 20, 2012 12:18am Jan 20, 2012 12:18am
  •  Phx62
  • Joined Jan 2009 | Status: Member | 924 Posts
This week has trended up but it has been choppy and lots of movement in the Asian session which I seldom trade. I did get in a good Asian trade on Tuesday, as explained in a previous post. Other than that day, nothing to write home about. It is very difficult to trade candles that have wicks at both ends....lots of fake outs. Maybe next week will be better.
Attached Image (click to enlarge)
Click to Enlarge

Name: 1.20.12.jpg
Size: 131 KB
 
 
  • Post #2,971
  • Quote
  • Jan 20, 2012 1:01am Jan 20, 2012 1:01am
  •  Steve 56
  • | Joined Dec 2011 | Status: Member | 53 Posts
In regard to what other Candles/Bars are not Classic Reversals. There are a lot of other patterns to use to help you find Pertinent reversals using X-Mans system. I like to look for Reversals off Support/Resistance. Look for other Patterns that are easy to see visually without trying to Micro manage each candle. We all wish we had X-mans and PHx 62s third eye. But I can assure you the simpler you keep it the easier and less stressful trading becomes. I have posted a chart with patterns that are easily identifiable and should help you with X-Mans signal. One of the most understated and never ever mentioned things in Trading is the Concept of Space. By that I mean to the left of Candle/Bar. Humans generally dont like clutter or others being in your face. How does that relate to Trading. Well the market likes Breathing Room or Space. Try trading with 5 or 6 Candles all in a row haphazardly up down all over the place and then look at Charts when the Candles/Bars move out of Consolidation with Space to its left. . Your setups are more likely to occur when you have space or room to move. You only need a couple of Candles to create SPACE. So look at the top of the body or wick and see if there is a gap there. I love Breakout Candles where it has created Space but sometimes creates an Inside or Outside Bar/Candle. The outside bar after initial breakout tries to create a HH or LL with Space at top or bottom or we get an Inside Bar which is stuck behind initial breakout and it creates new space with another break out bar, sometimes after making a number of bars/Candles. Remember Space may only be a few Candles/Bars. Even though 1 hour was not great last night, look at last nights 15 min Chart and you will see rev candles with space and others with Inside bar reversals that worked a treat especially off Supp/ Res. Pin Bars with Space are excellent at having successful set ups. By the way the Mas on chart are only to help visually. This is just another tool in your arsenal. I hope you find it useful. Unfortunately I have Appts this evening so I wont be on Forum till late. Steve
Attached Image(s) (click to enlarge)
Click to Enlarge

Name: eur 3.gif
Size: 26 KB
Click to Enlarge

Name: eur2.gif
Size: 29 KB
 
 
  • Post #2,972
  • Quote
  • Jan 20, 2012 1:33am Jan 20, 2012 1:33am
  •  X-Man
  • | Commercial Member | Joined Aug 2011 | 2,409 Posts
Quoting tonny47
Disliked
hi X-man,

sorry to disagree, i suppose you just didnt look properly but its the other way around. I only looked at the first candle at each picture.The first candle on first picture closed above its open and the opposite for the second picture.
what i was trying to say is that to me it seems like exactly the same circumstances
in a first picture, it was a red candle which closed higher in a downtrend (below the yellow moving average) and you said its no trade. in second picture, there was a blue candle in an uptrend (above the yellow moving average)...
Ignored
Hey there
Sorry about that i got the pictures the other way around. My explanation for picture 1 Will apply to Picture 2 and the explanation for picture 2 will apply for picture 1.
Ill post some charts where those candles took place then you will understand better. Then we will take it from there.

X-man the legendary conqueror of markets
 
 
  • Post #2,973
  • Quote
  • Jan 20, 2012 2:00am Jan 20, 2012 2:00am
  •  X-Man
  • | Commercial Member | Joined Aug 2011 | 2,409 Posts
Ok heres a chart to show how those candles work MOST of the time and not all the time.

The red arrow shows the candle that you posted (which was your second picture) in your chart Tonny. See what happens when that candle forms.
The green arrow shows the other candle you posted ( the first picture).

The blue arrows are the double candle signal to go short.
The yellow arrows are the signal to go long.

Does that make sense?
Attached Image (click to enlarge)
Click to Enlarge

Name: candle forms.jpg
Size: 112 KB
X-man the legendary conqueror of markets
 
 
  • Post #2,974
  • Quote
  • Jan 20, 2012 2:45am Jan 20, 2012 2:45am
  •  X-Man
  • | Commercial Member | Joined Aug 2011 | 2,409 Posts
Hale mary

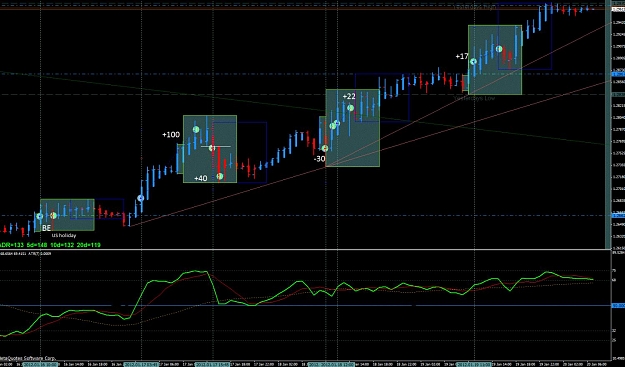
before i comment on your posted charts i would like to know if the red arrows are places where you went short and the green arrows are places where you went long ?
X-man the legendary conqueror of markets
 
 
  • Post #2,975
  • Quote
  • Jan 20, 2012 2:51am Jan 20, 2012 2:51am
  •  hale-mary
  • | Joined Nov 2011 | Status: Member | 271 Posts
Quoting X-Man
Disliked
Hale mary

before i comment on your posted charts i would like to know if the red arrows are places where you went short and the green arrows are places where you went long ?
Ignored
Oh sorry. please ignore them i forgot to take that indy off
 
 
  • Post #2,976
  • Quote
  • Jan 20, 2012 2:51am Jan 20, 2012 2:51am
  •  Bridau
  • | Joined Jan 2012 | Status: Member | 2 Posts
Pretty system. I've made 139 pips in two days (live account). But It seems to me there is some problem with SL.
 
 
  • Post #2,977
  • Quote
  • Jan 20, 2012 2:56am Jan 20, 2012 2:56am
  •  X-Man
  • | Commercial Member | Joined Aug 2011 | 2,409 Posts
Quoting hale-mary
Disliked
Oh sorry. please ignore them i forgot to take that indy off
Ignored
Ok could you post me a chart with more detail as to where you entered coz i cannot see the trades you took.
Mark the candle with an arrow so i know what im looking at


X-man the legendary conqueror of markets
 
 
  • Post #2,978
  • Quote
  • Jan 20, 2012 3:11am Jan 20, 2012 3:11am
  •  hale-mary
  • | Joined Nov 2011 | Status: Member | 271 Posts
Quoting X-Man
Disliked
Ok could you post me a chart with more detail as to where you entered coz i cannot see the trades you took.
Mark the candle with an arrow so i know what im looking at


Ignored
The chart with the red vertical lines are candles that I took the trade when they were forming and they completed. If the explanation or something is not clear on that one let me know.

The chart posted on 2953 i will try to make clearer.

The July charts I did not take any trades then as I had trouble figuring out how to tackle those situations in backtesting.
 
 
  • Post #2,979
  • Quote
  • Jan 20, 2012 3:23am Jan 20, 2012 3:23am
  •  X-Man
  • | Commercial Member | Joined Aug 2011 | 2,409 Posts
Quoting Bridau
Disliked
Pretty system. I've made 139 pips in two days (live account). But It seems to me there is some problem with SL.
Ignored
Thats good
What problem are you having with SL
X-man the legendary conqueror of markets
 
 
  • Post #2,980
  • Quote
  • Jan 20, 2012 3:28am Jan 20, 2012 3:28am
  •  X-Man
  • | Commercial Member | Joined Aug 2011 | 2,409 Posts
Quoting hale-mary
Disliked
The chart with the red vertical lines are candles that I took the trade when they were forming and they completed. If the explanation or something is not clear on that one let me know.

The chart posted on 2953 i will try to make clearer.

The July charts I did not take any trades then as I had trouble figuring out how to tackle those situations in backtesting.
Ignored
OK i looked at your trades and see that those are all correct
The third trade had a long tail, PA retraced there so i would be hesitant to go short.
The fourth trade i wouldve also incurred a loss if i took that trade.
So overall i would say that only your
3rd trade wasnt a good trade.
Did you start your back testing using my signal candles?
Are you starting to see the same kinda candles form over and over?
Attached Image (click to enlarge)
Click to Enlarge

Name: HM2.jpg
Size: 159 KB
X-man the legendary conqueror of markets
 
 
  • Commercial Content
  • /
  • X-Man's Super Simple System
  • Reply to Thread
    • 1 147148Page 149150151 559
    • 1 Page 149 559
0 traders viewing now
  • More
Top of Page
  • Facebook
  • Twitter
About FF
  • Mission
  • Products
  • User Guide
  • Media Kit
  • Blog
  • Contact
FF Products
  • Forums
  • Trades
  • Calendar
  • News
  • Market
  • Brokers
  • Trade Explorer
FF Website
  • Homepage
  • Search
  • Members
  • Report a Bug
Follow FF
  • Facebook
  • Twitter

FF Sister Sites:

  • Metals Mine
  • Energy EXCH
  • Crypto Craft

Forex Factory® is a brand of Fair Economy, Inc.

Terms of Service / ©2023