Jaroo and Mike et al mentioned the story of price (and the importance) a few pages back.... this story is progressing nicely.... hoping it continues and ends happily ever after
What you say about j, u take too long or it is in no close to 77 BN
Sorry for my bad English
Ignored
Hey Yehuda
No need to apologize your English is fine
I personally would not be playing with usd/jpy. We are stuck in a massive range stemmed from intervention type action back last year. I will be looking for this massive trendline to break or not watch till price hits 75. So basically 75 and 80 are my levels(with the trendline)
1. For a lower close price must close completely lower then the previous bars low/high. For a DBHLC that means price closes under the previous bars low. For a DBLHC price closes above the previous bars high.
Ignored
This clears things up., thanks.
Quote
Disliked
2. All price bars are not valid until the high/low breaks. So for a DBLHC a break of the high of the 2 bars that make up the setup would validate the setup. Thus for this reason many of us(including myself) will buy a break of the high. THis means the next bar(or however many after you are willing to wait) must simply cross the high to be considered valid. Of course there are other alternatives(retrace, entry on the close, entry perhaps on a close above as you said as well). That takes some fine tuning and practice to decide what might work best for you
I think I'm clear on this. So any break of the DBLHC/DBHLC is a valid setup, but the actual entry is up to the trader's preference or based on nearby levels.
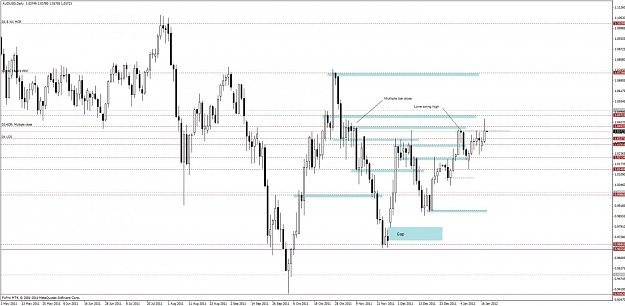
I'm watching the AUSUSD Daily and it's looking like a possible short setup to me based on a forming Pinocchio bar coupled with bearish divergence. However we're still holding above some seemingly significant Fib levels. What Price Action confirms the Pinocchio bar?
Thoughts?
Quote
Disliked
Hope this helps and again we're glad to have another new face pop in and ask questions
Mike
Thanks Mike, I hope I don't become a burden.
Where I've been, Ive been. Where I'm going, I'll go. I'm here now.
I appreciate the welcome. I'm planning on making this my home over the coming months.
This clears things up., thanks.
I think I'm clear on this. So any break of the DBLHC/DBHLC is a valid setup, but the actual entry is up to the trader's preference or based on nearby levels.
I'm watching the AUSUSD Daily and it's looking like a possible short setup to me based on a forming Pinocchio bar coupled with bearish divergence. However we're still holding above some seemingly significant Fib levels. What Price Action confirms the Pinocchio bar?
Thoughts?
Thanks...
Ignored
Hey DT
No burden at all
The actual pinbar itself would be your confirming bar(if it qualifies for you all things aside just focusing here on the basics). So after the pinbar if you choose to trade it, it then becomes part one of what you said on how you want to enter. But for a pinbar to be valid like the other bar setups it must break the bar. So if we are looking to short a pinbar, until the low is broken its not technically a pinbar.
So for 2 of the most common used entries here are some of the +s and -'s
Enter on a break - confirms the setup, a smaller position size is taken then other entries
Enter on a retracement - pro is a larger position size and getting in at a better price. Disadvantage is playing an unconfirmed bar
I am more conservative and consider waiting for a break to be more in line with what I am trying to accomplish
What do you think about the BEOB on EURCAD 4HR chart touching the long Downward TL @1.2976 and then moving down?
On the 1HR EURCAD, this area 1.2976 ~ 73 is also @ the 38.2% Fib
Thanks
vyky
Ignored
Hey Vyky
I would be reluctant to want to short this far down on just a beob alone. The TL is a long and good one but remember we do want to look for beobs traditionally at swing high points as James shows us. This is a deep swing low. So you have to be very careful with continuation bars. I always suggest learning them the way James presents them initially before trying to attempt continuation bars too. I prefer to watch the 1.3 area more then anything myself.
I would be reluctant to want to short this far down on just a beob alone. The TL is a long and good one but remember we do want to look for beobs traditionally at swing high points as James shows us. This is a deep swing low. So you have to be very careful with continuation bars. I always suggest learning them the way James presents them initially before trying to attempt continuation bars too. I prefer to watch the 1.3 area more then anything myself.
Best
Mike
Ignored
Thanks Mike for your valuable input. I was also waiting for the BEOB around 1.3000 area, but I thought the BEOB from 1.2976 was the very closest BEOB that could happen. I was very much tempeted to take this BEOB. With your advice, I am going to stay away from this BEOB and start looking for them at Swing High locations.
Mike, i just want to say Thanks for all your help and advice for newbies like me.
Also want to thank James 16 for offering this material for free, so that everybody can learn to trade with forex.
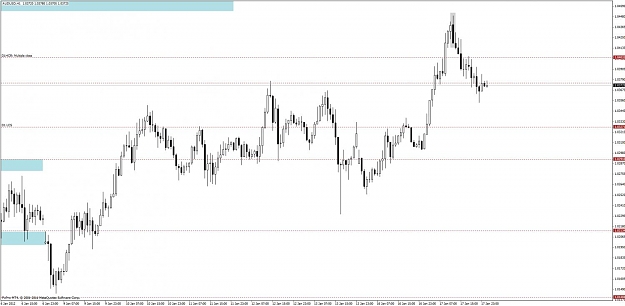
good trade but u can see how resistance is being respected. should it close above this resistance, the next level should be around 1.07540 area.
Ignored
Hi Sniper
I was watching this pair too. I agree that price is at a respected level (all be it a lone swing high) although I personally see a few more levels to watch before getting to 1.07540:
1.04033 (Multiple bar close), 1.4715 then into space up until 1.07286
I traded the 1h BEOB on this one today. No big run, just some steady profits (learned my lesson ping ponging losses last week).
This is of course my own view and progressing in my own trading as I go on.
Thanks Mike for your valuable input. I was also waiting for the BEOB around 1.3000 area, but I thought the BEOB from 1.2976 was the very closest BEOB that could happen. I was very much tempeted to take this BEOB. With your advice, I am going to stay away from this BEOB and start looking for them at Swing High locations.
Mike, i just want to say Thanks for all your help and advice for newbies like me.
Also want to thank James 16 for offering this material for free, so that everybody can learn to trade with forex.
Thanks
Vyky
Ignored
You are very welcome V, all kudos to the big guy though, this is all here because of him
The actual pinbar itself would be your confirming bar(if it qualifies for you all things aside just focusing here on the basics). So after the pinbar if you choose to trade it, it then becomes part one of what you said on how you want to enter. But for a pinbar to be valid like the other bar setups it must break the bar. So if we are looking to short a pinbar, until the low is broken its not technically a pinbar.
So for 2 of the most common used entries here are some of the +s and -'s
Enter on a break - confirms...
Ignored
Thanks Mike, that's a great help. When you enter on a retracement (assuming you ever might) are you using a fib based just off the high and low of just the signal bar?
Where I've been, Ive been. Where I'm going, I'll go. I'm here now.
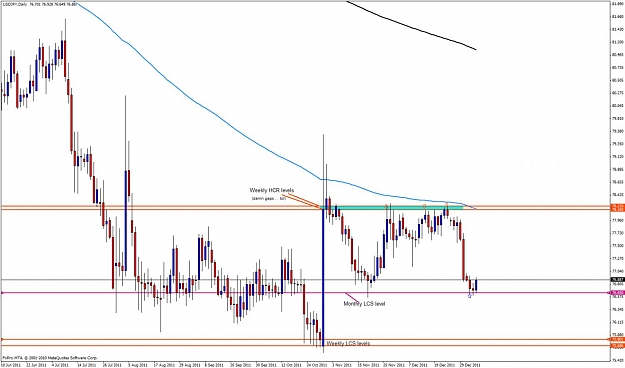
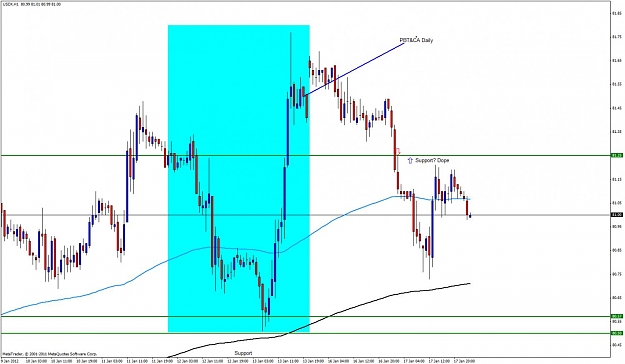
No surprise at how Price reacted . again . . to the Monthly Lowest Close of Support (LCS) level on the JPY .. .These are big story levels in my book . .. the Weekly levels are great too.
Focusing on just these levels and waiting for Price to get there, is the way to go for several reasons .
1. There are not that many of them, so we don't have a ton of lines on our charts.
2. There is usually big Space and/or little traffic if they breakout of these levels . .meaning if HCR/LCS levels are formed by a big consolidation area there will be...
Ignored
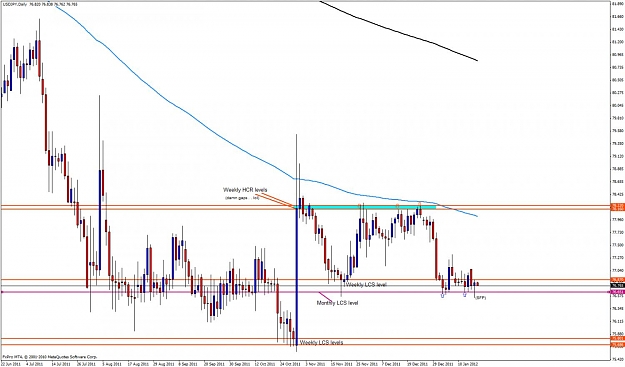
That Monthly LCS level is sure holding strong . . for now ..
Attached Image(s) (click to enlarge)
Indicators show the past. Price Action "Indicates" the future.
so so...just to confirm..we must first look for good S/R levels and then PA forming there, correct?and not the other way around. I mean we must not look for PA first and then S/R.
When, we start learning PA, first we can not find any, then we see it all over the place and finally, we understand that the PA must have a logical reason to form. Meaning, it is these deep Swing Highs & Swing Lows, bar highs and bar lows, that cause the PA to be born. The S&R is the cradle, the PA, the baby, that can either crawl or run, depending on where its feet are.
Good job....I think your post will help a great many people.
Ignored
That it, zamfir . . ..nice.
Cradle and baby . never heard that analogy before, Pinbar . .lol . .I like it . .
Indicators show the past. Price Action "Indicates" the future.
Bullish PA at swing Lows and Bearish PA at swing Highs allows for a higher probability of success. . .alll other things being considered such a Size, Space, etc.
Continuation PA needs to have more of a story behind it then just a BUOB in an uptrend. Search out many many of Mike's posts and charts where he shows "stories" of Price Patterens breaking out where PA does not appear at a Swing Highs or Low but part of a bigger story unfolding.
This BUOB, as you say, " . . what does a BUOB mean when it occurs between a uptrend?"...
Ignored
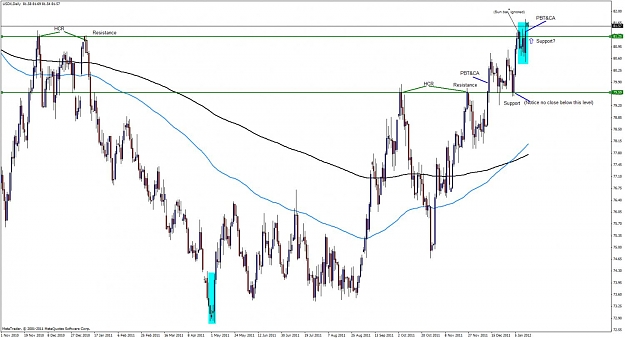
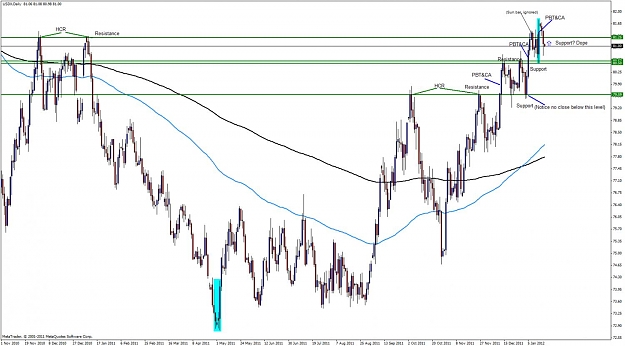
Looks like Price failed to act as Support at this previous Resistance level once PBT&CA on the Daily. BUOBs are still tricky at swing Highs even with a story of Resistance turning into Support within that PA formation.
What's great about these levels is if they fail to act like they are suppose too . . . they will usually return to there previous status . .in this case, returning to Resistance.
It sure did on the Hourly . . .right on the dot . .
Attached Image(s) (click to enlarge)
Indicators show the past. Price Action "Indicates" the future.
see the easy part is spotting the good areas right Pin?
the hard part is sitting on our hands. At least I think that's how it goes
Ignored
Yeah, you guys were right all the way along, from the very start, finding the good areas appeared to be, the hardest part. Yet, as you say, waiting for price to get there and the utter disgust when sometimes it does not do what we want it to, is the hardest part. It is almost like waiting for a girlfriend to arrive for an hour, then she drives right past you in the taxi. LOL
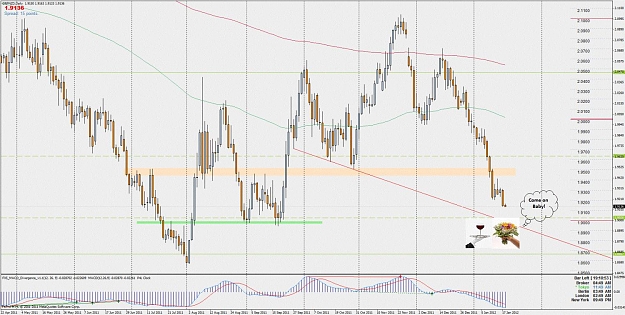
Great levels on the Gbp/Nzd, Pinbar . . not too many to look at, is there.
That .9450ish PPZ level should have had a stronger reaction of Support there . .what does that tell you about the down momentum of Price. . pretty strong.
I would look for that PPZ level to now act as Resistance . .which it almost did on the Daily.
Jim
Ignored
Yeah, Jim.
She jilted us at the train station. LOL
We will catch her yet, though.
EDIT: Ooops, forgot the wine.
Hey Donkey, what synchronicity.
I think she will prefer my flowers and wine though.
You just don't know how to treat a lady. LOL