Joined Dec 2006
|
Status: On the moon
|1,106 Posts
Bonjour,
a special trade today with EU.
I have often being asked how I manage to enter long at a supply, or short at a demand.
I have already explained a part of that here, when spotting forming engulfs of H1, H4 on M5 chart.
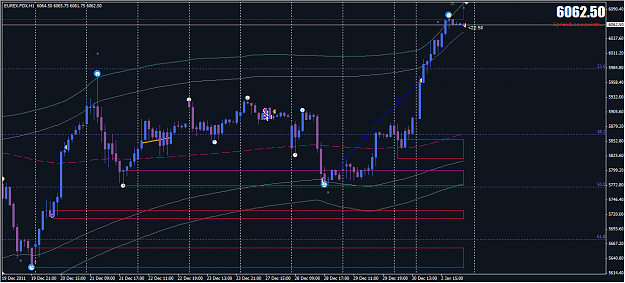
Here is another way for me to go against the zone: I take "the blue pill", sorry I mean the blue stairs. And how much it will cost me when every stair is already a banked long, and furthermore have a clear exit which is the dotted horizontal black line if not broken out.
Here is the chart let's wait.
Edit: Pasted things here cos better to regroup posts.
Here is how it is now, i will keep it as the last of the year.
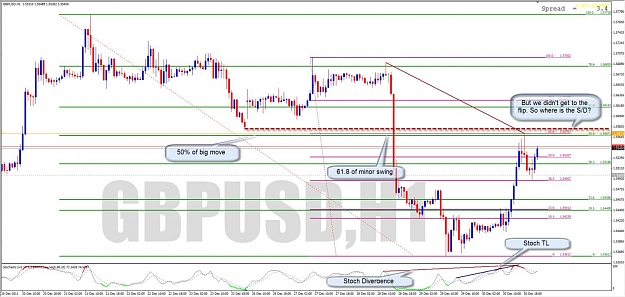
The stairs, the zone from a far east and pierced several times, an exit not far in case being wrong. And a push config just below the supply. If there wa more liquidity this one could have reached the 1.3000, but 1.2985 is not bad for the fifth one on this pair today.
and it stops there. time to take profits Target hit.
the ugly demand zone on the right that had no effect MIGHT have effect here, andd buyers look tired. Tp time.
(kenny post ur GU longs )
had a nice run. last for the week i guess i dont suspect any more swings of such.
will wait for significant supply/old support to sell (next week possibly)
|
Membership Revoked
|
Joined Nov 2010
|3,072 Posts
Thanks for the beautiful card, Ken.
A great artist as well as a great chartist
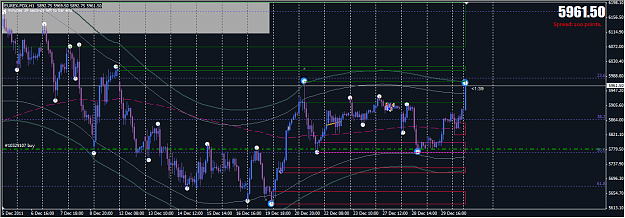
I've had a few moments to spare, so here's something on Confluence.
(I don't recommend obscuring your charts with all this stuff. For fibs, you'd be best to colour them as close to the background colour as possible.
These charts say nothing about watching correlated pairs, which really should be a given