• Home
  • Forums
  • Trades
  • News
  • Calendar
  • Market
  • Brokers
  • Login
  • Join
  • User/Email: Password:
  • 9:09am
Menu
  • Forums
  • Trades
  • News
  • Calendar
  • Market
  • Brokers
  • Login
  • Join
  • 9:09am
Sister Sites
  • Metals Mine
  • Energy EXCH
  • Crypto Craft

Options

Bookmark Thread

First Page First Unread Last Page Last Post

Print Thread

Similar Threads

10sma on Weekly Chart System 38 replies

Trading with a 10SMA 4 replies

What is the difference between an "interday" chart and "intraday" chart? 2 replies

1 bar in 1H chart = how many bar in 5min chart? 3 replies

gbpjpy tick chart difference with 5m chart 0 replies

  • Trading Systems
  • /
  • Reply to Thread
  • Subscribe
  • 365
Attachments: Daily Chart w/ 10sma
Exit Attachments

Daily Chart w/ 10sma

  • Last Post
  •  
  • Page 1 23456 69
  • Page 1 234 69
  •  
  • Post #1
  • Quote
  • First Post: Edited Mar 27, 2012 7:42pm Dec 12, 2011 11:54am | Edited Mar 27, 2012 7:42pm
  •  bkg102665
  • Joined Jun 2008 | Status: Member | 1,296 Posts
As my trading evolves I keep looking for easier ways to trade with less confusion and frustration. I have mainly used trendlines and s/r areas in the past. This has improved my trading over the years but I want to show you what I am doing now and I hope you will find this useful. We all trade with different time frames and exspectations. This is by far the simplest thing I have ever used and takes the guess work out for me. Are all my trades profitable.....NO!! I do not believe there is a system out there that can accomplish that. I have a few rules I use and I will be posting those rules along with examples to show what the set uo looks like on a chart. I hope you find this interesting and profitable.
Please ask questions and be an active part of this thread!
  • Post #2
  • Quote
  • Dec 12, 2011 12:25pm Dec 12, 2011 12:25pm
  •  Tedge UK
  • | Joined Dec 2010 | Status: Member | 698 Posts
Quoting bkg102665
Disliked
As my trading evolves I keep looking for easier ways to trade with less confusion and frustration. I have mainly used trendlines and s/r areas in the past. This has improved my trading over the years but I want to show you what I am doing now and I hopr you will find this useful. We all trade with different time frames and exspectations. This is by far the simplest thing I have ever used and takes the guess work out for me. Are all my trades profitable.....NO!! I do not believe there is a system out there that can accomplish that. I have a few rules...
Ignored
always looking to simplify (PROFITABLE) trading
  • Post #3
  • Quote
  • Dec 12, 2011 12:51pm Dec 12, 2011 12:51pm
  •  RobFX
  • | Joined Jul 2011 | Status: Member | 17 Posts
Thanks bkg102665...I'm looking forward to it!!

Simple is good...
  • Post #4
  • Quote
  • Dec 12, 2011 12:54pm Dec 12, 2011 12:54pm
  •  bkg102665
  • Joined Jun 2008 | Status: Member | 1,296 Posts
Use a daily chart with most any pair you like to trade.

Put a 10sma on the chart (red on my charts)

Always know where support and resistance levels are(aqua on my charts)because these are always good take profit areas and entry areas

I will only take shorts when price is at resistance level and then closes below the 10sma

I will only take longs when price is at support and then closes above the 10sma
Please ask questions and be an active part of this thread!
1
  • Post #5
  • Quote
  • Dec 12, 2011 1:16pm Dec 12, 2011 1:16pm
  •  bkg102665
  • Joined Jun 2008 | Status: Member | 1,296 Posts
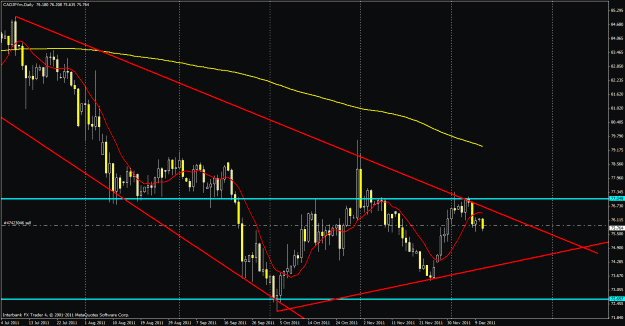
This a trade I entered short. Price touched my resistance line and then closed below my 10sma. I would be looking to take profit at the lower trend line, the support line, or get out of the trade if price closes back above the 10sma.
Attached Image (click to enlarge)
Click to Enlarge

Name: 1212cadjpy.gif
Size: 29 KB
Please ask questions and be an active part of this thread!
  • Post #6
  • Quote
  • Dec 12, 2011 2:28pm Dec 12, 2011 2:28pm
  •  bkg102665
  • Joined Jun 2008 | Status: Member | 1,296 Posts
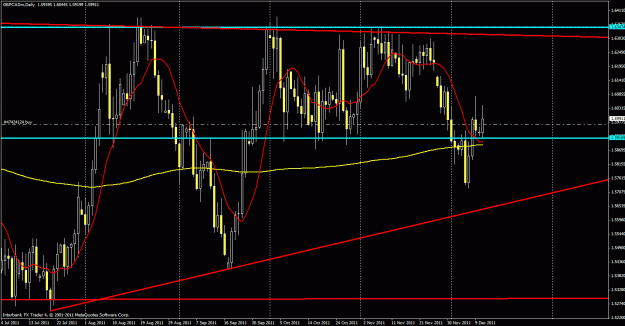
Same set up here except I am long
Attached Image (click to enlarge)
Click to Enlarge

Name: 1212gbpcad.gif
Size: 33 KB
Please ask questions and be an active part of this thread!
  • Post #7
  • Quote
  • Dec 12, 2011 2:45pm Dec 12, 2011 2:45pm
  •  RobFX
  • | Joined Jul 2011 | Status: Member | 17 Posts
thanks... I like it.

A couple of questions(which you may already be answering but I'm anxious):

Based on both charts, would it have been a valid signal from a couple of days early when it closed (above/below) the 10SMA - which I believe is yes.

If this is the case, what would the stop loss be?
  • Post #8
  • Quote
  • Dec 12, 2011 2:50pm Dec 12, 2011 2:50pm
  •  bkg102665
  • Joined Jun 2008 | Status: Member | 1,296 Posts
Quoting RobFX
Disliked
thanks... I like it.

A couple of questions(which you may already be answering but I'm anxious):

Based on both charts, would it have been a valid signal from a couple of days early when it closed (above/below) the 10SMA - which I believe is yes.

If this is the case, what would the stop loss be?
Ignored
Yes the trades I have shown were entered a few days ago. My stop loss would be if a candle closes on the opposite side of my 10sma.
Please ask questions and be an active part of this thread!
  • Post #9
  • Quote
  • Dec 12, 2011 2:51pm Dec 12, 2011 2:51pm
  •  bkg102665
  • Joined Jun 2008 | Status: Member | 1,296 Posts
This is a trade I will be entering if price closes where it is now.
Attached Image (click to enlarge)
Click to Enlarge

Name: 1212audusd.gif
Size: 31 KB
Please ask questions and be an active part of this thread!
  • Post #10
  • Quote
  • Dec 12, 2011 2:58pm Dec 12, 2011 2:58pm
  •  bkg102665
  • Joined Jun 2008 | Status: Member | 1,296 Posts
BTW please feel free to ask questions about this and any currency pair you may be looking at. Just so you know I use IBFX as my broker mainly because their candles along with the 10sma seem to be more reliable than other brokers that may close the day at a different time. I also use FXDD as my second broker but base all my trades off of IBFX charts.
Please ask questions and be an active part of this thread!
  • Post #11
  • Quote
  • Dec 12, 2011 3:02pm Dec 12, 2011 3:02pm
  •  Tedge UK
  • | Joined Dec 2010 | Status: Member | 698 Posts
Quoting bkg102665
Disliked
Yes the trades I have shown were entered a few days ago. My stop loss would be if a candle closes on the opposite side of my 10sma.
Ignored
wow,thats uncanny,I pretty much trade the same as yourself,here's the same chart but with a lines instead or bars or candles,basically I trade 123 set ups then once in trade look for break of s/r areas to add to trend .....simples
Attached Images (click to enlarge)
Click to Enlarge

Name: au.gif
Size: 43 KB Click to Enlarge

Name: au1.gif
Size: 36 KB
  • Post #12
  • Quote
  • Dec 12, 2011 3:15pm Dec 12, 2011 3:15pm
  •  bkg102665
  • Joined Jun 2008 | Status: Member | 1,296 Posts
This is an alert I had made that has the ability to alert w/ alarm, a pop up window, and an email. It will alert you when a daily candle crosses and close the 10sma. You will get the alert at the close of the daily candle. I run this on 20+ currencies and every night around 8 pm I get emails to tell me which pairs have crossed the 10sma and closed. Remember that you want to take short trades when price is close to resistance and long trades when price is near support.
Attached File
File Type: mq4 bkg10sma alert.mq4   3 KB | 3,052 downloads
Please ask questions and be an active part of this thread!
  • Post #13
  • Quote
  • Dec 12, 2011 4:02pm Dec 12, 2011 4:02pm
  •  elway
  • | Joined Jul 2008 | Status: Member | 69 Posts
Interesting that I came across this thread. I used to experiment with almost the same trading technique a while back. Price first had to cross the 9 SMA and the next day the trade was made if/when the price broke the first day's candle instead of at the close of first day's candle as you do. There is definitely a lot of potential to this simple method if one has a good system to filter your SMA crosses.
  • Post #14
  • Quote
  • Dec 12, 2011 4:10pm Dec 12, 2011 4:10pm
  •  bkg102665
  • Joined Jun 2008 | Status: Member | 1,296 Posts
Another rule of mine, once you are up 100 pips move your s/l to +5 and let the trade run. Often these trades will run for +500 pips.
Please ask questions and be an active part of this thread!
  • Post #15
  • Quote
  • Dec 12, 2011 4:13pm Dec 12, 2011 4:13pm
  •  dutchsignals
  • | Commercial Member | Joined Jul 2007 | 201 Posts
Hi,

When the daily candle breaks through the `ma 10 , for a short trade enter the trade 1/2 pips below the low of that day,
it give more conformation of the trend.

Also plot an RSI 14 in the chart and draw trendlines of the bottom, when it is broken , it is another conformation
try it and you will see it.

dutch signals
  • Post #16
  • Quote
  • Dec 12, 2011 4:27pm Dec 12, 2011 4:27pm
  •  GEOFFREY62
  • | Joined Jun 2007 | Status: GEOFFREY62 | 184 Posts
Hi BKG
I have a question if I may. On your AUD/USD chart just posted you say you will short if candle closes where it is now. The thing I dont under stand is that at no time do I see this as a resistance line.If you look to left on your chart around aug1st price came down and bounced at support for about 4days or so, price then went up and came back downaround 8sept and again bounced on support for about 4/5 days then dropped through, made a new low then shot back up going straight through previous support, so no resistance there, price came back down around 11nov and again bounced around support level before dropping through making another low then went back up again straight through previous support level so no resistance there came back down and again bounced 5/6 at same support level and has now dropped through again. So my question is after all that, how do you see this as a resistance area which as you say you will short if candle closes as is ? I only see this as a support area and cannot see any where that price at this level was turned back and then went down. Any help much appreciated
Many Thanks
Geoff
  • Post #17
  • Quote
  • Dec 12, 2011 4:29pm Dec 12, 2011 4:29pm
  •  Tedge UK
  • | Joined Dec 2010 | Status: Member | 698 Posts
Quoting dutchsignals
Disliked
Hi,

When the daily candle breaks through the `ma 10 , for a short trade enter the trade 1/2 pips below the low of that day,
it give more conformation of the trend.

Also plot an RSI 14 in the chart and draw trendlines of the bottom, when it is broken , it is another conformation
try it and you will see it.

dutch signals
Ignored
hey Dutch can you place a chart.... I get what you mean but good for noobies ,cheers Tedge
  • Post #18
  • Quote
  • Dec 12, 2011 4:40pm Dec 12, 2011 4:40pm
  •  bkg102665
  • Joined Jun 2008 | Status: Member | 1,296 Posts
I have remarked my charts and colored the areas where I see this as s/r. I hope this helps.
Attached Image (click to enlarge)
Click to Enlarge

Name: 1212audusd.gif
Size: 32 KB
Please ask questions and be an active part of this thread!
  • Post #19
  • Quote
  • Dec 12, 2011 4:47pm Dec 12, 2011 4:47pm
  •  GEOFFREY62
  • | Joined Jun 2007 | Status: GEOFFREY62 | 184 Posts
Thanks for reply BKG but all the areas you have remarked on you chart I see as support , where does this become resistance allowing you you take a short?
Geoff
  • Post #20
  • Quote
  • Dec 12, 2011 4:49pm Dec 12, 2011 4:49pm
  •  bkg102665
  • Joined Jun 2008 | Status: Member | 1,296 Posts
I am expecting price to come down and close the gap I have high lighted
Attached Image (click to enlarge)
Click to Enlarge

Name: 1212audusd.gif
Size: 26 KB
Please ask questions and be an active part of this thread!
  • Trading Systems
  • /
  • Daily Chart w/ 10sma
  • Reply to Thread
    • Page 1 23456 69
    • Page 1 234 69
0 traders viewing now
  • More
Top of Page
  • Facebook
  • Twitter
About FF
  • Mission
  • Products
  • User Guide
  • Media Kit
  • Blog
  • Contact
FF Products
  • Forums
  • Trades
  • Calendar
  • News
  • Market
  • Brokers
  • Trade Explorer
FF Website
  • Homepage
  • Search
  • Members
  • Report a Bug
Follow FF
  • Facebook
  • Twitter

FF Sister Sites:

  • Metals Mine
  • Energy EXCH
  • Crypto Craft

Forex Factory® is a brand of Fair Economy, Inc.

Terms of Service / ©2021