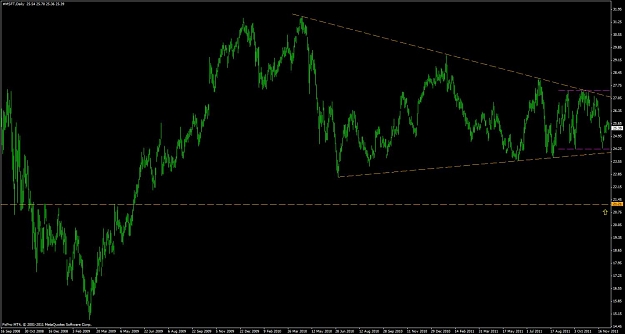
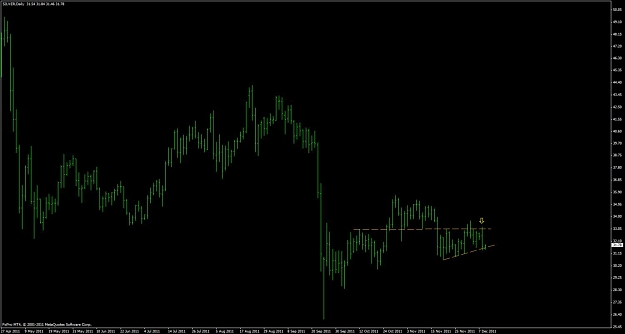
Nice wedge formation here. Note how price is now hugging the triple top resistance rather than selling off as violently as it did before.
The current D1 print is a bearish outside bar which may see selling come in on retracements but it's a difficult one to play because a retracement would take you right back into the range.
For now I am watching this formation for a breakout and retest.
Yes I know this is a Forex website but a setup is a setup.
And I've said it before and will say it again. If stocks didn't have the problem of major gaps on almost every open and traded continuous I would probably never look at a forex chart again.
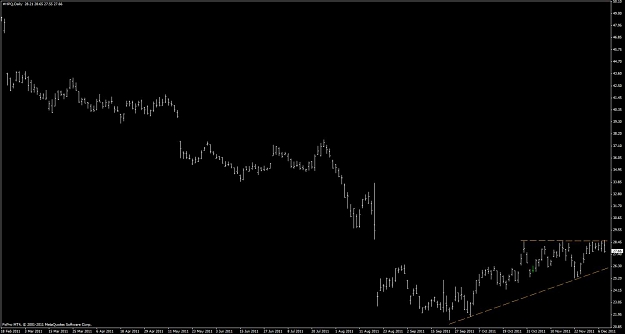
There is a very significant ascending and descending TL in play here with multiple clean touches. I would be very interested to see which way this goes and see if I can enter on a break and retest, particularly if it coincides with a s/r pivot (see purple lines)
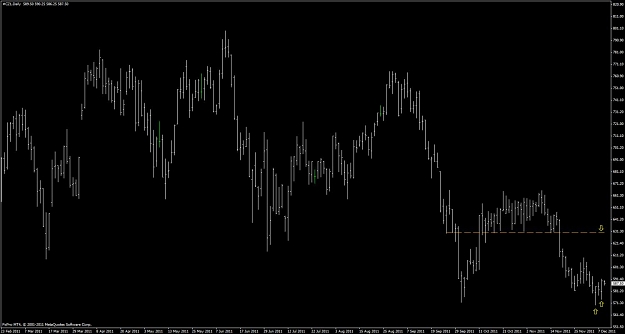
If the lower TL breaks and there is no retracement, I will bid blind at 21.21.
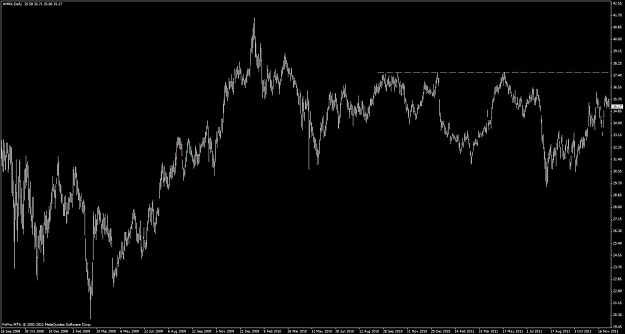
This is the only other order I currently have in which is to short Silver at 32.25.
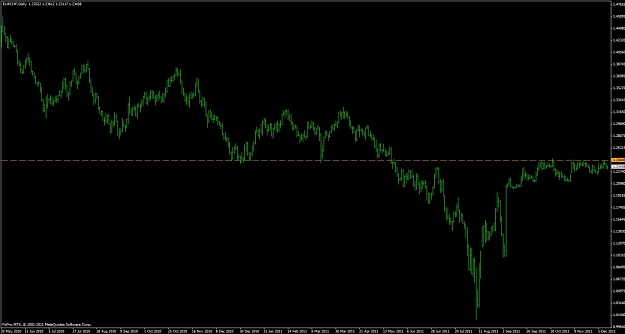
This is a little riskier. First chart shows the bearish outside bar off resistance for the third time that takes us right into the ascending TL. The reason it is risky is that selling a retracement is taking a position back into the range before a break. However, I am going to give it a go.
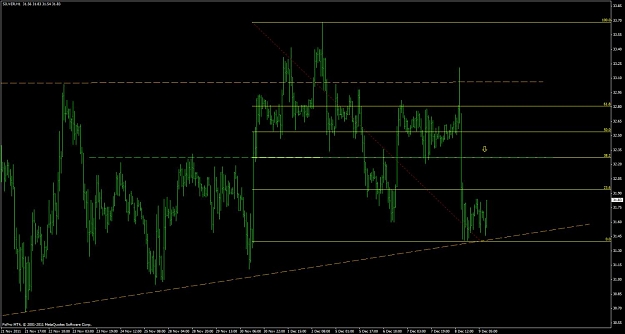
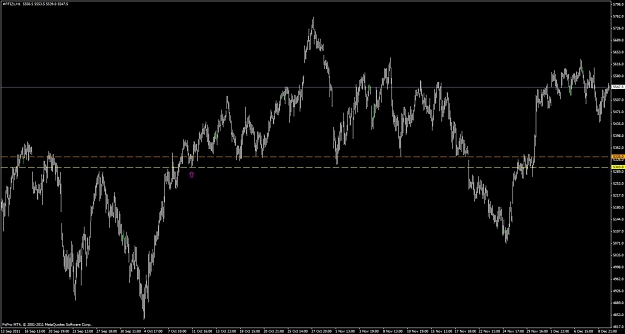
Second chart shows the H1 entry into an s/r pivot (support last) with 38 fib confuence for all you fib lovers :-)
If I get a fill and it moves back down to the lows and trigger the D1 BEOB (bearish outside bar), I will try and get some more on and look for a bigger move to the downside.
First lower yellow arrow shows an excellent D1 SFP that was also a pin bar. This triggered and formed a BUOB (bullish outside bar) in yesterdays trading. The upside still looks very good in this but the upper level at 630 would be a sell for me.
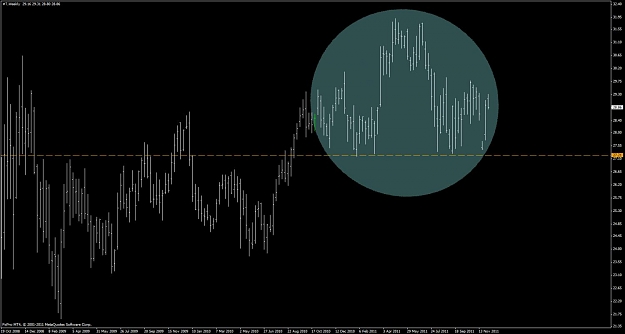
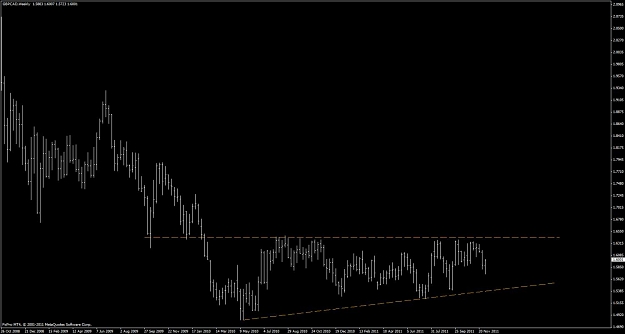
This is GBP/CAD. Before anyone jumps down my throat and shouts "I thought you don't trade the crosses!!"...I DO NOT actively look for setups in them and most of the situations that people present to me in the crosses I pass on. However, if, from time to time, I see an excellent setup then I will watch it and consider an entry.
Setups like this are few and far between. This is a WEEKLY resistance with multiple touches over an extended period of time.
Note how the WEEKLY time frame has posted an SFP last week ( I didn't mark it so you can train your eyes :-)).
There are a lot of charts for you all to check through.
I know the vast majority of these posts are not FX related but the quality of the levels and setups should give you an idea (for those that are new) or a reminder (for those that are familiar) of just how good I want setups to be.
I saw a great quote the other day that went something along the lines of "Stick to the A grade trades and try not to do anything stupid in the meantime."
And I've said it before and will say it again. If stocks didn't have the problem of major gaps on almost every open and traded continuous I would probably never look at a forex chart again.
Ignored
I keep looking at stocks and consider venturing outside the FX world for more setups but the gaps concern me. May I ask Tom how you deal with gaps in the stocks you trade? Do you close out the position before final bell to avoid them?
I keep looking at stocks and consider venturing outside the FX world for more setups but the gaps concern me. May I ask Tom how you deal with gaps in the stocks you trade? Do you close out the position before final bell to avoid them?
Ignored
There are many ways to do this.
Here are a few examples ;
1) Trade stocks unleveraged. This is what I do for the most part, however the problem with this is that you need a large account to make any kind of "decent" profit in monetary terms.
2) Close out before the bell. However, what if an excellent setup occurs near to the close? You also have the issue that you may not have time in a single session to see the trade through to your target and therefore achieve the R you intended.
3) Use a "guaranteed stop". This is for those that use spreadbetting like I do. The problem with a guaranteed stop is that it often has to be placed at a minimum distance which may be further than you would have liked. It also costs you money in terms of extra spread. However, it is definetly the safest option with leveraged positions.
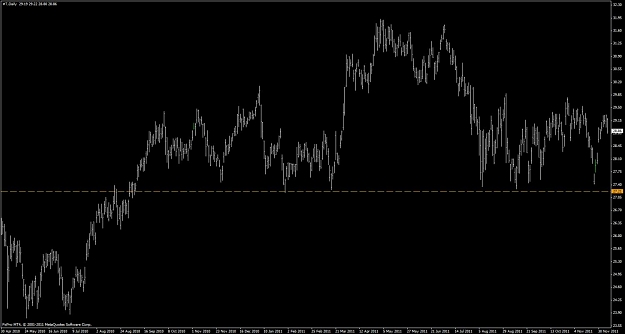
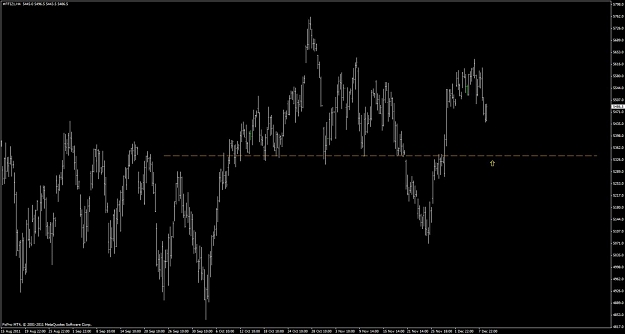
In a situation like this on FTSE where would you consider the best area to place your stop?
cheers.
Ignored
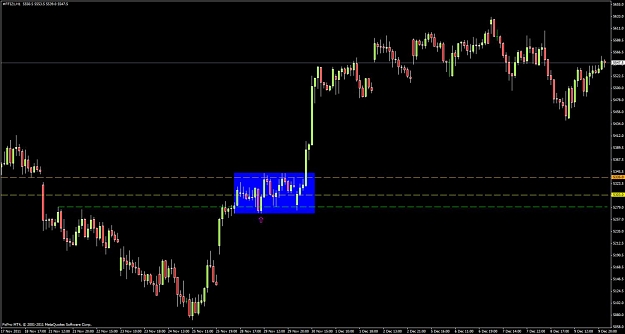
Stop placement can be tricky and sometimes takes some serious consideration. One of the things I like to do is look at whether the level has been primarly support or resistance. I usually want to buy what was resistance last but in this case I can see that the level has been most significant as support. So I tend to mark off the extreme of that support. In the first chart you will see that marked with a purple arrow. As a result I would already be thinking that I want my stop beyond this at a minimum.
If we now zoom in and take a look at the second chart you can see the orange level (the buy point) the yellow level (the extreme) and you can now see a further minor h1 s/r pivot marked in green.
You can also see the "range" or "box" that was made marked in blue.
I think a conservative place for a stop would be just below the lows of this box and below the second pivot.
Having said all of this, one of the things that I believe has greatly increased my profitability and also one of the hardest things to do from a psychological perspective is get out when you get a warning sign that the trade is not working.
The reason it is so hard to do is that traders cling onto hope. They use all sorts of reasons to justify this hope, ignoring warning signs and holding a trade blindly to their stop. They say things like "well I have planned for this loss with my risk management so it's no big deal if it stops me out" or "What if I get out early and then the trade goes my way? I should just hold it to my stop"
When I put a stop in the market, I place it a point where I believe I am totally wrong on the trade idea but I am always watching the market for signs that I am wrong before my stop is hit.
I find that the vast majority of the time that I get my first warning sign, the market will go onto hit my stop so now I just get out as soon as these signs present themselves to me.
Last week, for example, I had two losing trades. With the warning signs I managed to lose 0.49 R on the first and 0.24 R on the second. Both would have stopped me out for a full 1 R loss if I had not taken action. When I lose 0.73 R in two trades and I could have lost 2 R, then I consider this a minor win.
Now don't get me wrong, obviously I haven't won anything in monetary terms - I am still down - but what I am doing is preserving my capital. And let's face it, making back 0.73 R is a hell of a lot easier than making back 2 R.
It comes back to the old adage : keep your losses small.
The signs are numerous. In the case of this FTSE trade, one might be the market closing through the buy level on the H1, retesting this buy level from below (the trader is now trapped) and then making a new low. However, there are a fair few.
This is something to go over in a future webinar as it is a very important skill to master and what I need to show you is the difference between acting on a genuine sign of trouble and just acting out of fear of losing (which is obviously not what you want to do).
One thing I just thought about mentioning. You will see me switch between bar charts and candlestick charts in this thread when I post charts. Traders often ask me which is the best to use and personally I don't think it makes any difference.
They both show the same information although I think candlestick charting is more popular because of the numerous "patterns".
I personally use candlesticks in my trading but it really doesn't make any difference to me. They are not an edge they are just a way of assimilating the information quicker and since I am so used to them now I find I can take that info in fractionally quicker than if I look at a bar chart.
|
Joined Feb 2009
|
Status: Price Stalker
|1,197 Posts
First trade and I made a mistake, looking for a Sunday Gap on FXPro and calculated the gap as 48 pips, but it was 4.8 really as it has 5 decimal places. Doh! Closed the trade and paid the spread, so lost £1.95.
Economists have forecast 9 out of the last 5 recessions