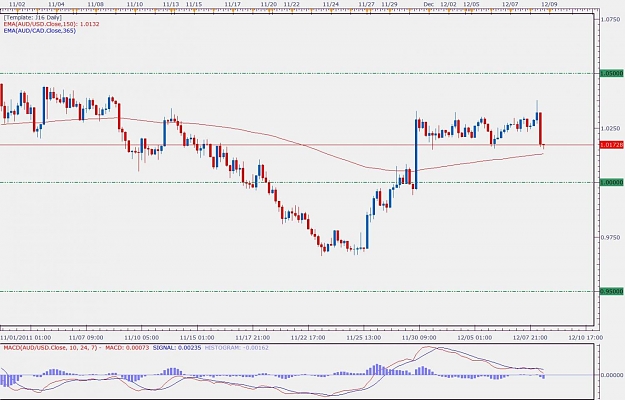
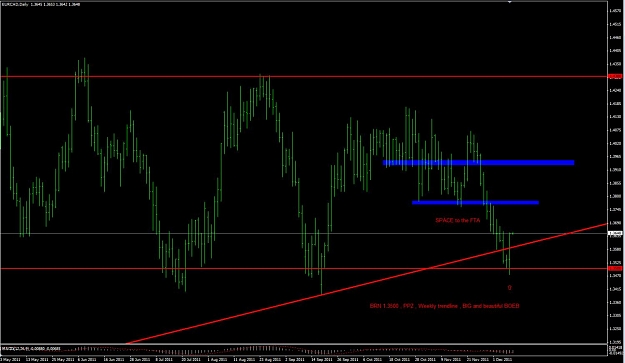
mbqb11, aren't you concerned by FTA created by the range price action just behind. It can act as a strong resistance.
 james16 Chart Thread
- #105,043
- Dec 8, 2011 10:55am Dec 8, 2011 10:55am
- Joined Aug 2010 | Status: Tööröh | 14,292 Posts
Hero calls followed by margin calls...