• Home
  • Forums
  • Trades
  • News
  • Calendar
  • Market
  • Brokers
  • Login
  • Join
  • User/Email: Password:
  • 9:33am
Menu
  • Forums
  • Trades
  • News
  • Calendar
  • Market
  • Brokers
  • Login
  • Join
  • 9:33am
Sister Sites
  • Metals Mine
  • Energy EXCH
  • Crypto Craft

Options

Bookmark Thread

First Page First Unread Last Page Last Post

Printable Version

Similar Threads

Super Simple System 314 replies

Mr Blobby V2 Super Simple 1m strategy 106 replies

X-Man's super simple system 4 hour method 1 reply

Super Simple 5min Scalping 32 replies

Super simple indicator request... 2 replies

  • Commercial Content
  • /
  • Reply to Thread
  • Subscribe
  • 2,890
Attachments: X-Man's Super Simple System
Exit Attachments

X-Man's Super Simple System

  • Last Post
  •  
  • 1 2021Page 222324 559
  • 1 Page 22 559
  •  
  • Post #421
  • Quote
  • Nov 29, 2011 5:55pm Nov 29, 2011 5:55pm
  •  a.youssry
  • | Joined May 2010 | Status: Member | 1 Post
Hello Traders
This is my first post in FF, so go easy on me
first thank you X-Man for this nice strategy, looking forward to implement it and i want to share with you a little addition to the system

as X-Man said i went to read Malon's work and he had a little hint that might be in handy with all newbies like my self

in his charts he add two moving averages
(1) 5-SMA shift 0 price low
(2) 5-SMA shift 0 price High

These two moving average form a Band around the 4-EMA (shift 2) that we use in X-Man Charts ... so according to the place of the 4-EMA in this band we can see if the trend is going to be strong or not

in long position the best setup is when the 4-EMA is below to the the lower band (which is the Low 5-SMA)or near to the bottom quarter of the band, and in the Short position the best setup is when the 4-EMA is above the higher Band (which is the High 5-SMA) or near to the Top quarter of the band

this rule make your trading more conservative so i guess you can apply it to the 15m charts when you decide to enter the trade for reassuring

another thing from observation ... when you enter a trade the best setupt is when the Synrgy candles closes above or below the band
so in a long position you want to see a candle that is closed above the higher Band (which is the High 5-SMA), and in short Position you want to see a candle that is closed below the lower band (which is the Low 5-SMA)

Again i think this rules are conservative, so i guess you use it when you decide to enter a trade and check these rules in a lower time frame (for example 15m)

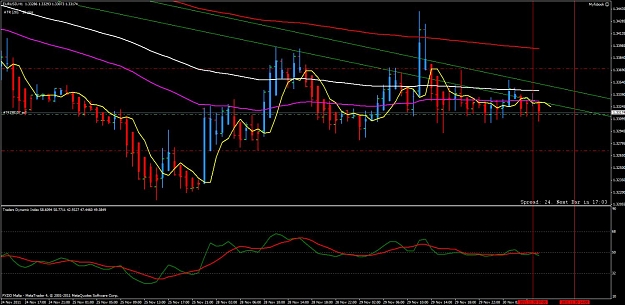
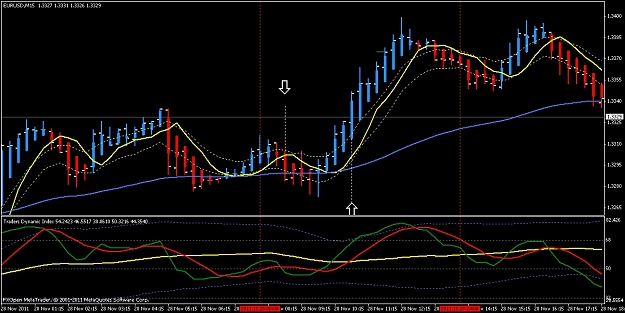
i attached the 15m chart for the trade in the UK open (28th November) the one that we went short and hit SL and the one that we should have taken Long

the first candle which is the 8:45 in my chart is the last one we saw and we should entre after it and it was quite risky to enter short in it as the candle didn't close below the Band and the band was inside the channel (both conditions are not met)
and the 2nd one is the of 10:45 and it was promising as both conditions are met

again it is just an observation that i actually find Handy and i will use ... and i thought why not sharing (if it wasn't for BigE and X- Man sharing we wouldn't be here in the first place)

Thank you again x-Man for the nice thread .. keep the pips coming Man
Attached Image (click to enlarge)
Click to Enlarge

Name: EURUSD_M15_strategy name_20111130005229.jpg
Size: 203 KB
if you are of part of the solution then you are part of the problem
  • Post #422
  • Quote
  • Nov 29, 2011 5:59pm Nov 29, 2011 5:59pm
  •  SmokeyD
  • | Joined Nov 2011 | Status: Member | 437 Posts
Quoting X-Man
Disliked
nice trading there smokey D i scored myself a nice 50 pips during the NY session
Ignored
Very nice take for the session!
Enter Signature
  • Post #423
  • Quote
  • Nov 29, 2011 7:32pm Nov 29, 2011 7:32pm
  •  todd960960
  • | Joined Nov 2008 | Status: Member | 470 Posts
Here's an alternative indicator that puts the lines in place for you in case you don't want boxes on your chart.

Blue line is 2hrs before UK open
White line is 2hrs before US open
Red line is UK close

Large dashed line is EOD
Attached Image (click to enlarge)
Click to Enlarge

Name: eu sho.gif
Size: 44 KB
Attached File
File Type: mq4 Trading Session vLines.mq4   10 KB | 548 downloads
  • Post #424
  • Quote
  • Nov 29, 2011 11:25pm Nov 29, 2011 11:25pm
  •  Wbm
  • | Joined Jun 2011 | Status: Member | 74 Posts
Your chart slightly resembles the British flag lol. Anyway thanks for the indicator . Btw how has starting 2 hours before london open gone for everyone? I know X-Man starts then but I want to see how everyone else is doing? I start an hour before london open but most of the time have to wait till London opens before a clear signal is given.

Quoting todd960960
Disliked
Here's an alternative indicator that puts the lines in place for you in case you don't want boxes on your chart.

Blue line is 2hrs before UK open
White line is 2hrs before US open
Red line is UK close

Large dashed line is EOD
Ignored
  • Post #425
  • Quote
  • Nov 30, 2011 12:36am Nov 30, 2011 12:36am
  •  X-Man
  • | Commercial Member | Joined Aug 2011 | 2,409 Posts
Quoting a.youssry
Disliked
Hello Traders
This is my first post in FF, so go easy on me
first thank you X-Man for this nice strategy, looking forward to implement it and i want to share with you a little addition to the system

as X-Man said i went to read Malon's work and he had a little hint that might be in handy with all newbies like my self

in his charts he add two moving averages
(1) 5-SMA shift 0 price low
(2) 5-SMA shift 0 price High

These two moving average form a Band around the 4-EMA (shift 2) that we use in X-Man Charts ... so according to the place of...
Ignored
Yip i noticed dean malone using those 2 MAs on his chart. If traders want to add those MAs then they are more welcome to do so.
Its 5 SMA shift 0 high
and 5 SMA shift 0 low.

I know snarly jack uses these 2 sma's on his charts. You will notice the volatility when PA breaks out of the bands and when PA is in between the bands its ranging a bit.
It would be a good idea for the beginners to use them because just before the London market opens you will see that PA will be in between those bands and once the london session opens you will see that PA will break that bands and you can trade in that direction.
X-man the legendary conqueror of markets
  • Post #426
  • Quote
  • Nov 30, 2011 12:41am Nov 30, 2011 12:41am
  •  X-Man
  • | Commercial Member | Joined Aug 2011 | 2,409 Posts
Quoting SmokeyD
Disliked
[size=3][font=Lucida Sans Unicode]X-Man, please correct me if I'm wrong.

There still seems to be some uncertainty about where the vertical lines should be placed to indicate the session times. I understand them to start 1 hour prior to the London and NY open.

We are to observe the market for trading opportunities during the first 1-3 candles INCLUDING the 1 hour candle out vertical line is attached to.

littlebunny provided us with an indicator as well as a couple of how to .docs to box in your sessions automatically everyday in post #28. Here...
Ignored
Yip those boxes seem to be correct.

X-man the legendary conqueror of markets
  • Post #427
  • Quote
  • Nov 30, 2011 12:53am Nov 30, 2011 12:53am
  •  X-Man
  • | Commercial Member | Joined Aug 2011 | 2,409 Posts
I have noticed that since i opened this thread theres some professional traders as well as other traders that aint Too happy with me for sharing this system with fellow traders.
They are traders that used this system for a very long time and they feel that since so many people know about it now they wont be so successful as they were before.
You get such stupid people.
I dont believe there such things as secrets in trading forex because if you want your system to work more than you have to tell lots of people.
The more traders that know about it the better your system will work because everyone will be looking at the same thing.

Ill always share because Big E showed me success so i have to show everyone else the light at the end of the tunnel. I cant keep it to myself, if Big E kept his trading ways to himself then i wouldnt be here today


X-man the legendary conqueror of markets
  • Post #428
  • Quote
  • Nov 30, 2011 1:05am Nov 30, 2011 1:05am
  •  viocable
  • | Joined Apr 2007 | Status: Member | 119 Posts
X-MAN, Do we have "Bounce TDI" trade here? Short EU?
Attached Image (click to enlarge)
Click to Enlarge

Name: contoh nih3.gif
Size: 15 KB
  • Post #429
  • Quote
  • Nov 30, 2011 1:25am Nov 30, 2011 1:25am
  •  X-Man
  • | Commercial Member | Joined Aug 2011 | 2,409 Posts
Quoting viocable
Disliked
X-MAN, Do we have "Bounce TDI" trade here? Short EU?
Ignored
No theres no bounce trade yet the candles are still ranging and small.

the candle look like its taking off now so just wait for the candle to close first to make any desicions
X-man the legendary conqueror of markets
  • Post #430
  • Quote
  • Nov 30, 2011 1:28am Nov 30, 2011 1:28am
  •  Rodcisal
  • | Joined Oct 2011 | Status: Member | 99 Posts
Quoting viocable
Disliked
X-MAN, Do we have "Bounce TDI" trade here? Short EU?
Ignored
I'm watching the same.
X-Man, do you look at other TF in order to get a hint where the trend is going?


What does it mean that plain slope of TDI curve just in the level of 50?


regards.
let's skype: @elchinoazul
  • Post #431
  • Quote
  • Nov 30, 2011 1:29am Nov 30, 2011 1:29am
  •  X-Man
  • | Commercial Member | Joined Aug 2011 | 2,409 Posts
Another chart from PHX62

this trader makes a ton of pips using the 1H method.

He made 100 pips yesterday and the other day he made 121 pips.


Attached Image (click to enlarge)
Click to Enlarge

Name: 11.29.11.gif
Size: 67 KB
X-man the legendary conqueror of markets
  • Post #432
  • Quote
  • Nov 30, 2011 1:32am Nov 30, 2011 1:32am
  •  singth
  • | Joined Jan 2011 | Status: Member | 81 Posts
Morning, One and all...finally think ive got the hang of this trading thing.. first trade of the day and i got myself into +20 pips for the day... happy days! i trade the m15 for entry and shi channel shows the 1hr timeframe.. and i entered at the start of the 6am (gmt) candle and of course exited for 20pips..
  • Post #433
  • Quote
  • Nov 30, 2011 1:32am Nov 30, 2011 1:32am
  •  X-Man
  • | Commercial Member | Joined Aug 2011 | 2,409 Posts
Quoting Rodcisal
Disliked
I'm watching the same.
X-Man, do you look at other TF in order to get a hint where the trend is going?


What does it mean that plain slope of TDI curve just in the level of 50?


regards.
Ignored
you can use the 15m or 30m chart for entries thats what some traders do. I just use the 1H chart
X-man the legendary conqueror of markets
  • Post #434
  • Quote
  • Nov 30, 2011 1:34am Nov 30, 2011 1:34am
  •  dominique74
  • | Joined Oct 2011 | Status: Member | 7 Posts
Waiting for the bearish candle to close.

My bias is that today may be break down day if there's no confidence coming out from the EU meetings.

Nonetheless, please note the resistance level at 1.3360 and the stronger one at 1.3450.

1.3281 represents a fair support area.
  • Post #435
  • Quote
  • Nov 30, 2011 1:51am Nov 30, 2011 1:51am
  •  MichaelSimon
  • | Joined Sep 2011 | Status: Member | 66 Posts
Hey Xman,
Nice to be reading your own thread and system. Good luck and good job for all the effort that you put into it. I remember all the effort you put into testing and backtesting different possibilities.
Tried to get you back on Skype last night but something was up with it and by the time I realized, you were offline. Anyways talk later.
I opened a small demo to test the method. Will try and keep it pure a straight forward. I do have some questions about supporting snr, fib levels, etc.. in regards to entry or targets but will leave it for later.
Looks like a short setup on the EU this morning, although I just realized you say not to enter till the candle close... uh oh..
Hopefully Ill get away with it cos I think eu is very bearish. We will see.
Michael
Attached Image (click to enlarge)
Click to Enlarge

Name: nov 30 london short.jpg
Size: 124 KB
  • Post #436
  • Quote
  • Nov 30, 2011 1:55am Nov 30, 2011 1:55am
  •  viocable
  • | Joined Apr 2007 | Status: Member | 119 Posts
Quoting X-Man
Disliked
Another chart from PHX62

this trader makes a ton of pips using the 1H method.

He made 100 pips yesterday and the other day he made 121 pips.


Ignored

This PHX62... does he trade just watch the H1 only or any other time frame too? Form his chart, I saw that every TDI Cross, he seems to wait PA go to above or below MA then he enter with the direction of TDI. he will not wait until the candle close. For ex, TDI Cross Buy, he wait to price go above MA then he entered, I guess. Does he trade like that?
  • Post #437
  • Quote
  • Nov 30, 2011 2:01am Nov 30, 2011 2:01am
  •  SmokeyD
  • | Joined Nov 2011 | Status: Member | 437 Posts
Assume everyone is aware it's a fairly big news day.

I would suggest scaling into any position conservatively.
Enter Signature
  • Post #438
  • Quote
  • Edited at 2:07am Nov 30, 2011 2:05am | Edited at 2:07am
  •  chixie007
  • | Joined Jul 2011 | Status: Member | 55 Posts
good thread.
I catch the london time.
Attached Image (click to enlarge)
Click to Enlarge

Name: LD.gif
Size: 28 KB
  • Post #439
  • Quote
  • Nov 30, 2011 2:10am Nov 30, 2011 2:10am
  •  chixie007
  • | Joined Jul 2011 | Status: Member | 55 Posts
right picture here.the vertical line in right time here.
Attached Image (click to enlarge)
Click to Enlarge

Name: LD.gif
Size: 28 KB
  • Post #440
  • Quote
  • Nov 30, 2011 3:03am Nov 30, 2011 3:03am
  •  davlo
  • | Joined Apr 2011 | Status: davlo | 133 Posts
what do you guys thimk of this deal
Attached Image (click to enlarge)
Click to Enlarge

Name: euro.gif
Size: 26 KB
  • Commercial Content
  • /
  • X-Man's Super Simple System
  • Reply to Thread
    • 1 2021Page 222324 559
    • 1 Page 22 559
0 traders viewing now
  • More
Top of Page
  • Facebook
  • Twitter
About FF
  • Mission
  • Products
  • User Guide
  • Media Kit
  • Blog
  • Contact
FF Products
  • Forums
  • Trades
  • Calendar
  • News
  • Market
  • Brokers
  • Trade Explorer
FF Website
  • Homepage
  • Search
  • Members
  • Report a Bug
Follow FF
  • Facebook
  • Twitter

FF Sister Sites:

  • Metals Mine
  • Energy EXCH
  • Crypto Craft

Forex Factory® is a brand of Fair Economy, Inc.

Terms of Service / ©2021