Attached Image (click to enlarge)
Dan
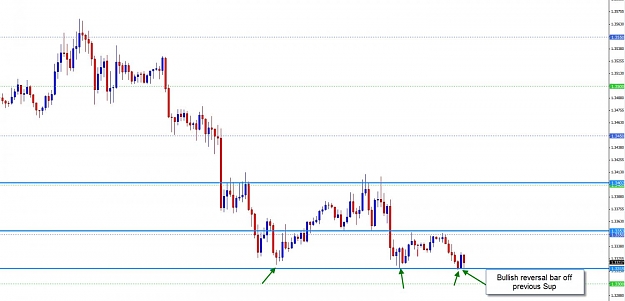
Edit:
made a really stupid mistake and posted the 30min chart. Was rushing ... but the same basically applies to the 5min chart + a hammer type candle indicates buyers are in, hence a good reason to exit ... i think
Attached Image (click to enlarge)


