DislikedHi ya Mtrader123..
I would be interested if you could please put up a couple of charts explaining how this system works in case it may be of use with my trading method.....any past chart trades would be ok as I want to see exactly, visually what we are looking for with this method..
Many thanks for any help you can give on this
Cheers,
AdrianIgnored
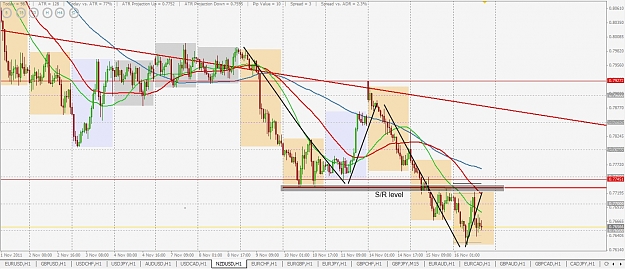
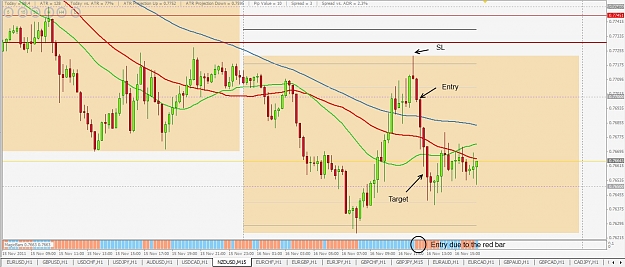
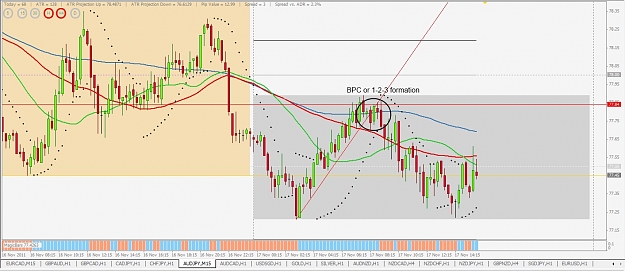
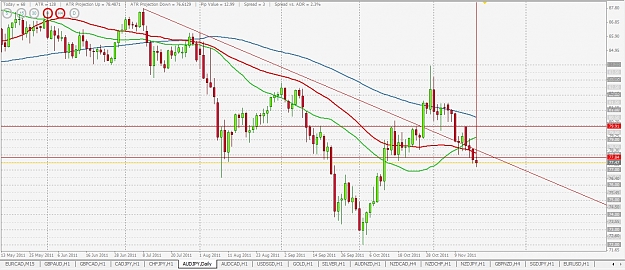
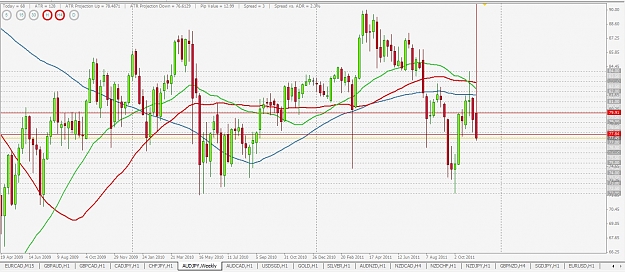
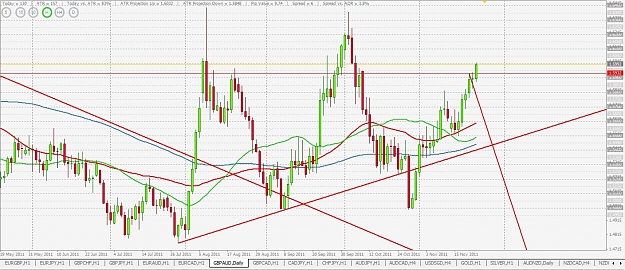
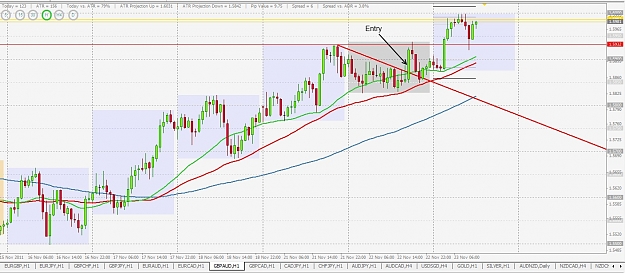
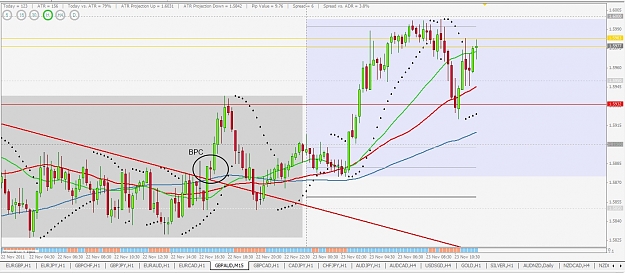
As for NZDUSD, there was a downtrend, price bounced up, went down, breached the S/R level, pulled back and continued in the direction of the downtrend. After the breach and pull back, once you are close to the S/R level you switch to 15m TF and look for an entry using Hector's indicator which is akin to the Parabolic SAR. The pics are selfexplanatory..
What I found out is that winning trades evolve very quickly without hesitation or testing your SL. This was also the case with NZDUSD as you can see - 40-45 pips in 45 minutes.
Attached Image(s) (click to enlarge)