I am a newbie and intending to post my chart analysis from start. I spent almost one year studying Stock Trading, then Forex Trading. That was till last July 2011. Currently, I am practicing the technical analysis based on the following:
* I am trading forex.
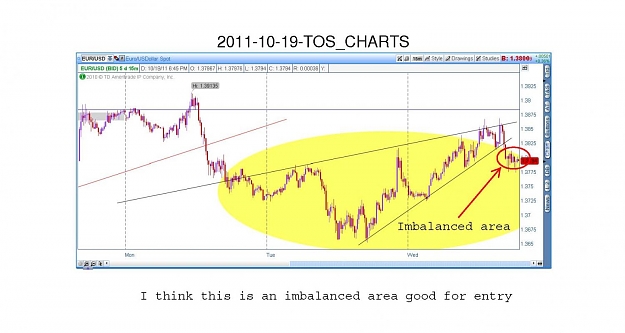
* I trade Supply and Demand with three perspectives: Imbalances, Consolidation and S/R flip zones. As a fresh newbie, these three perspectives require more learning and practice, especially the 'Imbalances'.
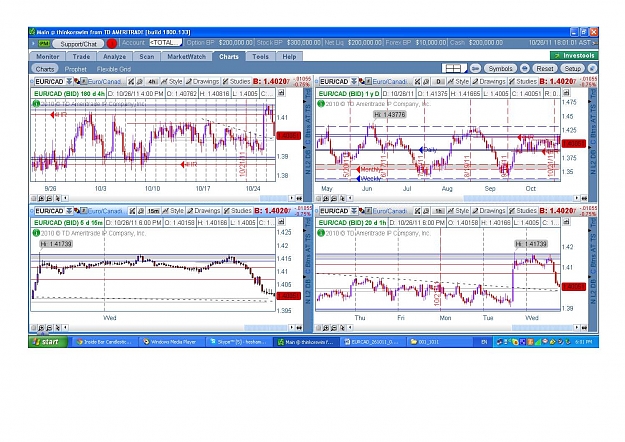
* My levels are mainly based on the Daily chart for market direction identification, 4HR chart for entry allocation, and 1HR/15Min for entry determination. Actually, I get overall view on the market by looking at the M & W TFs.
* S/R confluences, TLs, Candle and Chart formations (i.e. M&W, Pinbars @ the right levels) and Fib's Levels comprise the charting toolbox. Indicators/Oscillators are excluded.
* My favorite pairs are EUR/USD, EUR/CAD, and USD/CHF.
* I plan to take trading as part time career then upgrade to full time career in due course. Swing trading fits for first partial plan.
* My practice plan stages are:
- Chart technical analysis,
- Position sizing, place orders, money management,
- Paper trade with a target of 70% profit and 30% loss.
- Trade live.
* My practice plan time frame could be 6 months to one year before I go live.
* I have developed a preliminary trading plan based on a template, but it is subject for further updates as I go with practice.
* Legend of marked lines on my charts (i.e. TL, PL, etc.) are based on TFs as follows
- Monthly TF: Red/Dashed Line,
- Weekly TF : Blue/Dashed Line,
- Daily TF : Blue/Straight Line,
- 4HR TF : Red/Straight LIne,
* I may end up with a chart having 10-12 lines in different colors; key levels could be 2-4 at which I may risk my money.
* I am disciplined, patient, and never chase a trade. I plan to trade and trade the plan.
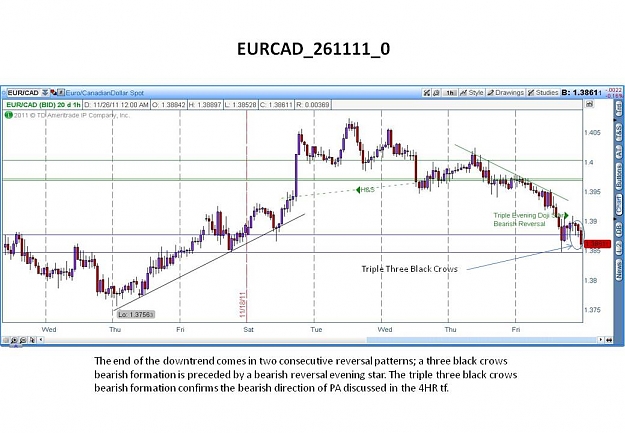
* The following attachments are for the chart analysis session on 26/10/11
* I am trading forex.
* I trade Supply and Demand with three perspectives: Imbalances, Consolidation and S/R flip zones. As a fresh newbie, these three perspectives require more learning and practice, especially the 'Imbalances'.
* My levels are mainly based on the Daily chart for market direction identification, 4HR chart for entry allocation, and 1HR/15Min for entry determination. Actually, I get overall view on the market by looking at the M & W TFs.
* S/R confluences, TLs, Candle and Chart formations (i.e. M&W, Pinbars @ the right levels) and Fib's Levels comprise the charting toolbox. Indicators/Oscillators are excluded.
* My favorite pairs are EUR/USD, EUR/CAD, and USD/CHF.
* I plan to take trading as part time career then upgrade to full time career in due course. Swing trading fits for first partial plan.
* My practice plan stages are:
- Chart technical analysis,
- Position sizing, place orders, money management,
- Paper trade with a target of 70% profit and 30% loss.
- Trade live.
* My practice plan time frame could be 6 months to one year before I go live.
* I have developed a preliminary trading plan based on a template, but it is subject for further updates as I go with practice.
* Legend of marked lines on my charts (i.e. TL, PL, etc.) are based on TFs as follows
- Monthly TF: Red/Dashed Line,
- Weekly TF : Blue/Dashed Line,
- Daily TF : Blue/Straight Line,
- 4HR TF : Red/Straight LIne,
* I may end up with a chart having 10-12 lines in different colors; key levels could be 2-4 at which I may risk my money.
* I am disciplined, patient, and never chase a trade. I plan to trade and trade the plan.
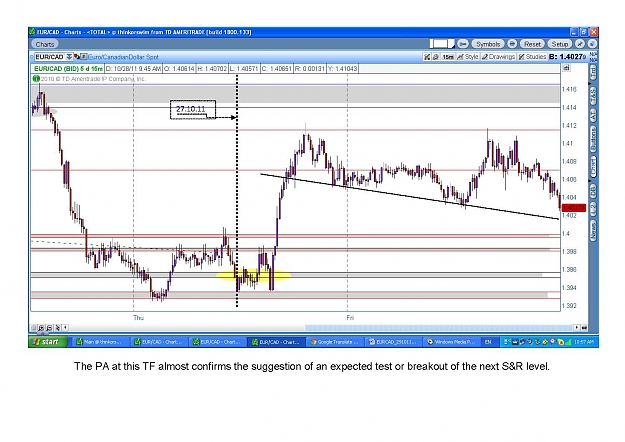
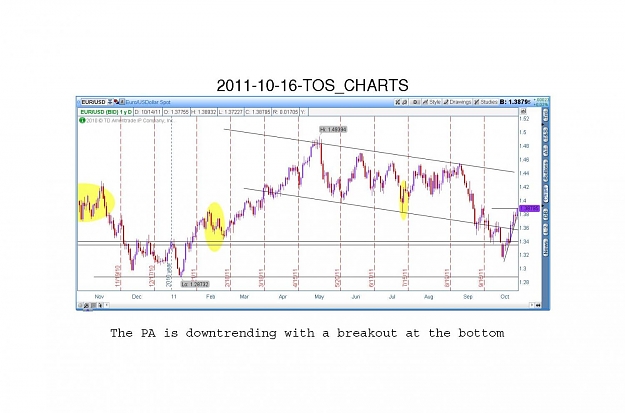
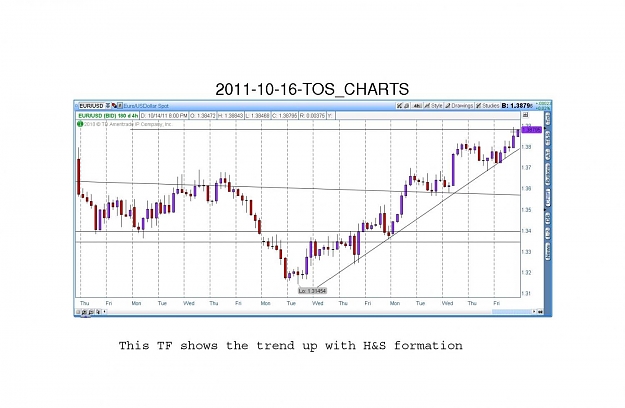
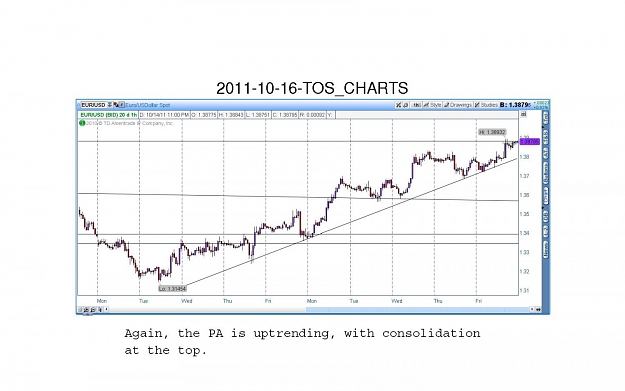
* The following attachments are for the chart analysis session on 26/10/11
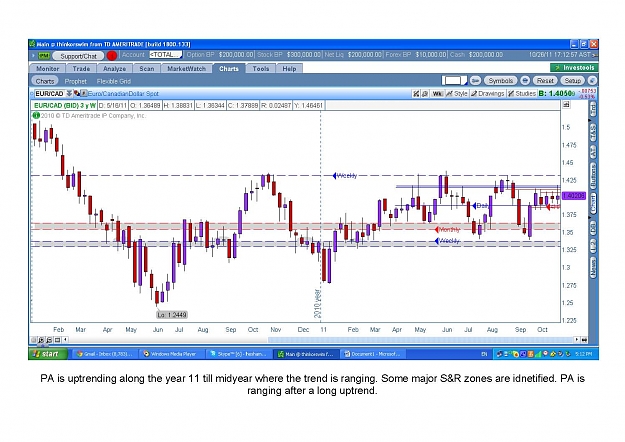
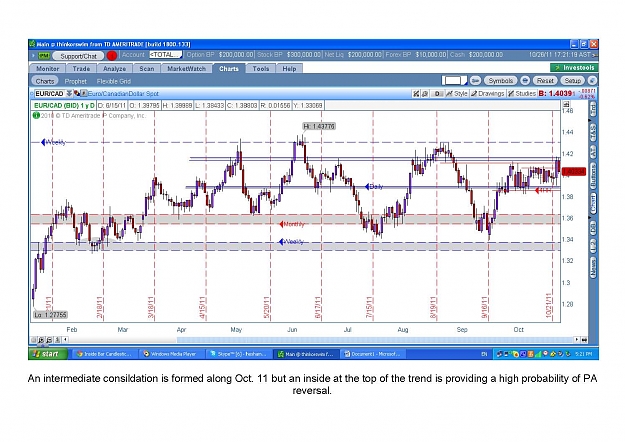
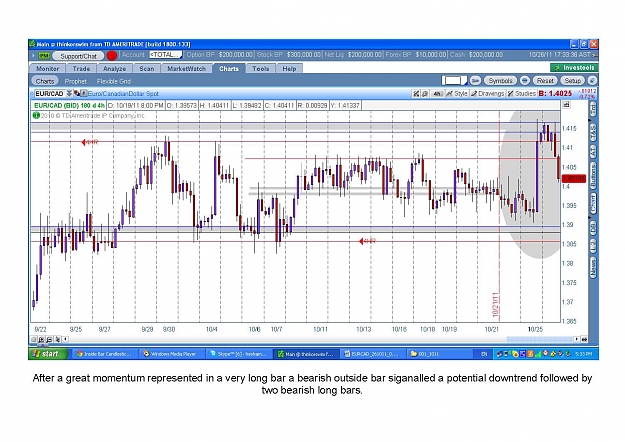
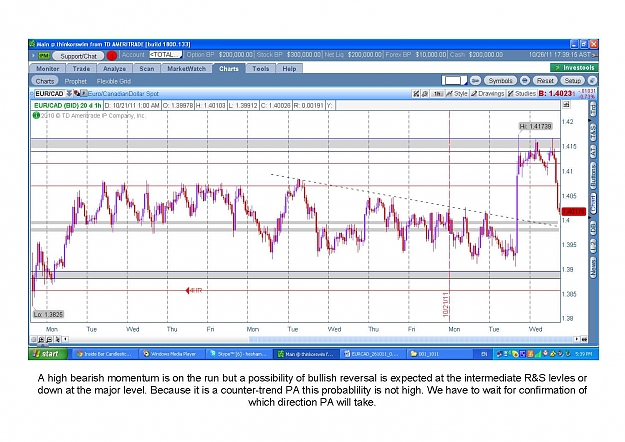
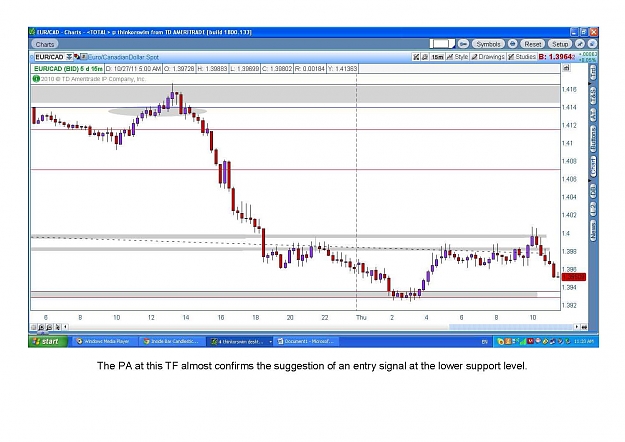
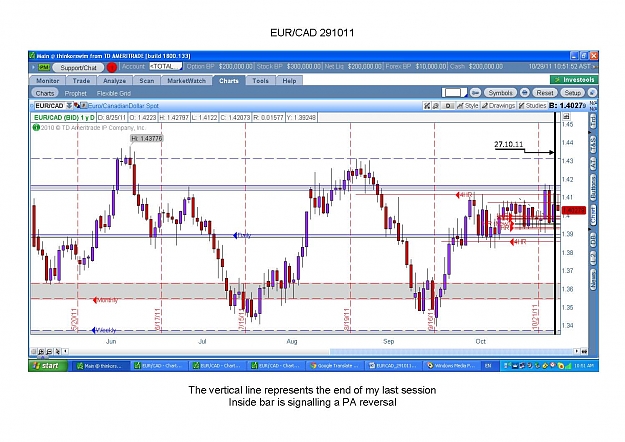
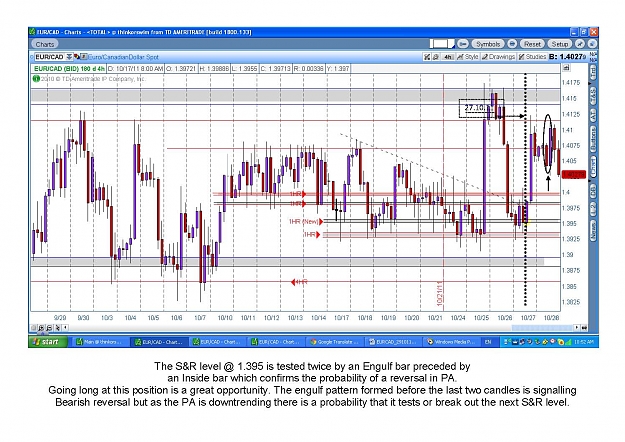
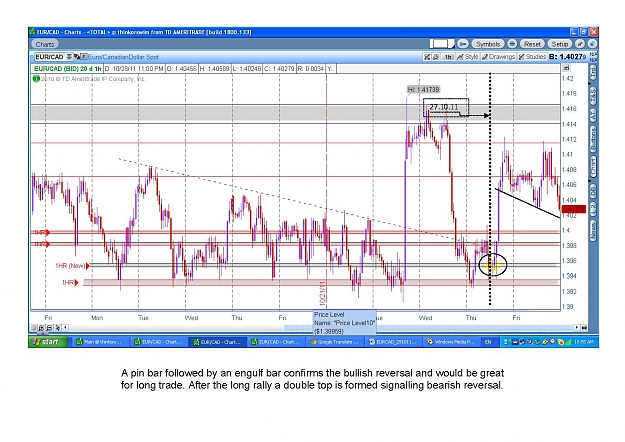
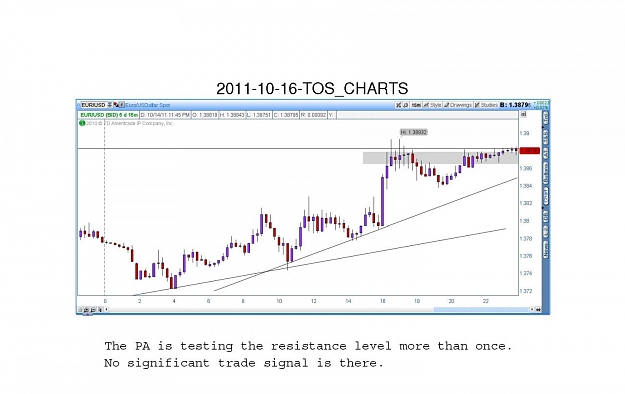
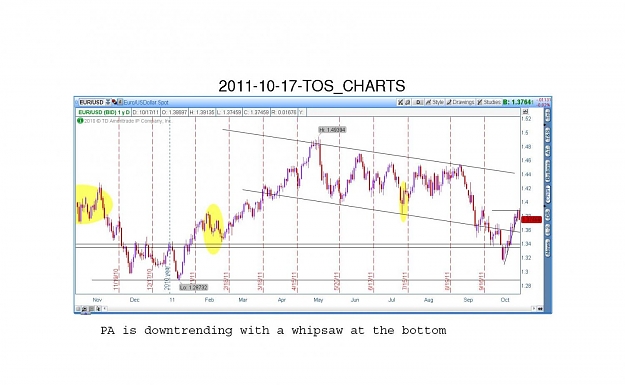
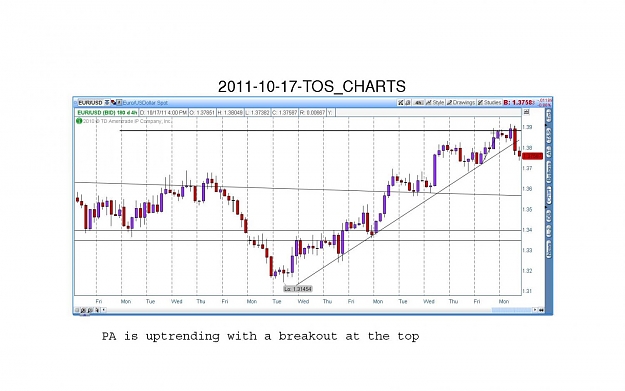
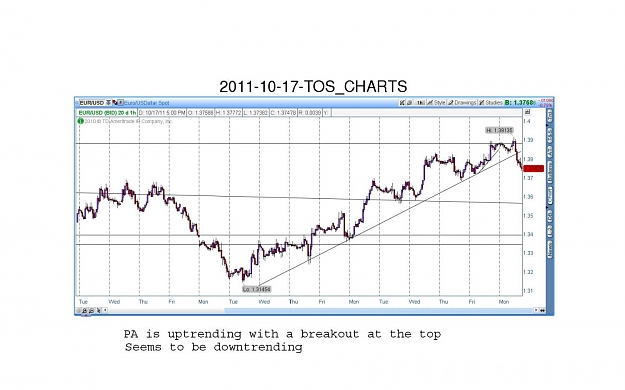
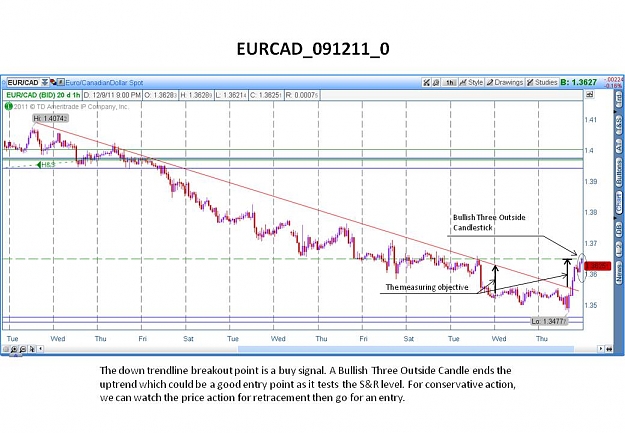
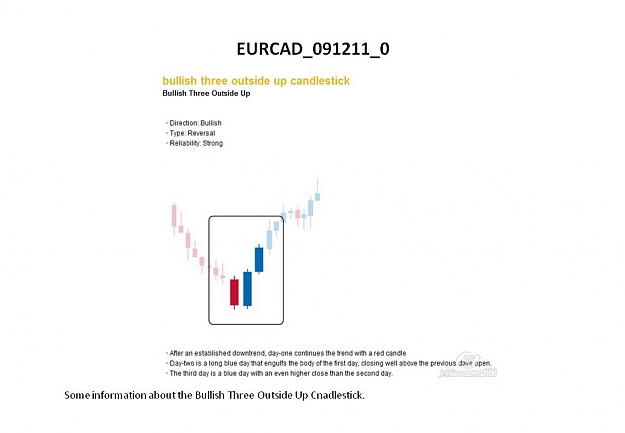
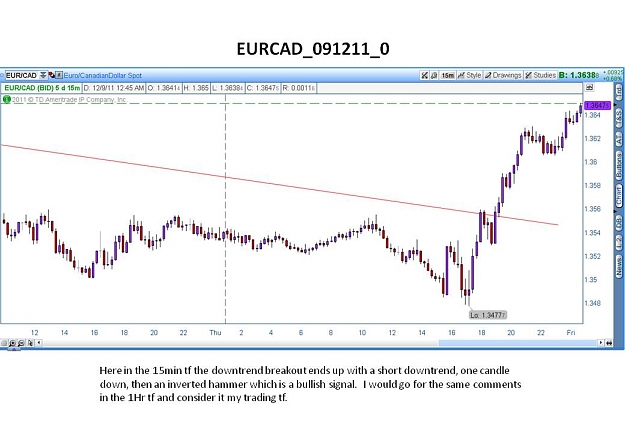
Attached Image(s) (click to enlarge)