This is just a post of a pin on the daily USDCAD chart. I don't know if Jim would mind others posting examples here.
This pin also bounces around the area that prices failed to move upwards past in early-mid Feb, so it could be a failed test of this area of resistance.
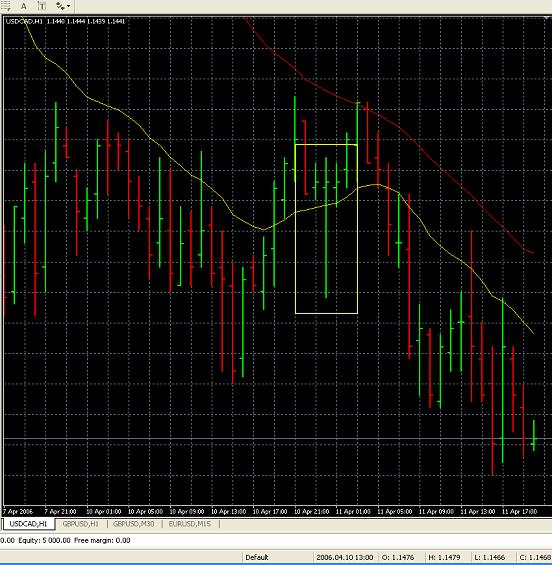
This could be played as a daily pin bar for a SHORT trade (enter on break, 1.1572 (10 pips below the low) and SL at 1.1665 (just above top of the pin)). If you prefer to use shorter time frames you could use this as an indication that prices may have peaked and the trend may be turning to resume down.
Cheers,
Linc.
This pin also bounces around the area that prices failed to move upwards past in early-mid Feb, so it could be a failed test of this area of resistance.
This could be played as a daily pin bar for a SHORT trade (enter on break, 1.1572 (10 pips below the low) and SL at 1.1665 (just above top of the pin)). If you prefer to use shorter time frames you could use this as an indication that prices may have peaked and the trend may be turning to resume down.
Cheers,
Linc.
Attached Image