I am usually not available to take part in the webinars.... so I was not aware of the 88 .
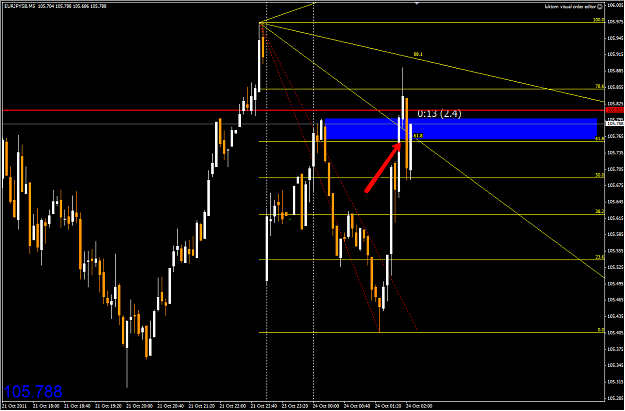
So buyers and sellers must be using the 88 line otherwise it would not work. Now I am even more curious as to how that came about.
Of course if it works, use it.
I am going to adjust my fib fan.
So buyers and sellers must be using the 88 line otherwise it would not work. Now I am even more curious as to how that came about.
Of course if it works, use it.
I am going to adjust my fib fan.