"the congregation of the three dashed lines crossing at the top"
-- crossover dot (or point). I've done these before, notably with l.p.3; only, the crossover dot itself served as a neutral balance for the TL's crossing at it, a screen so to speak. The crossover dot was very much in the past, with lots of confirmation after the dot from PA for the multiple TL's.
Now, I believe I have a good handle on how to project a crossover dot into the future. This'd have at least a couple of applications, first and foremost in dramatically increasing trade precision, and secondly in projecting l.p.3's (which, when it works, is as good as or better than a Gann Fan).
Then, another example of a projected crossover dot:
----------
another idea, likely also well-worn
and then stated in a way that then fits into my way of tying everything together:
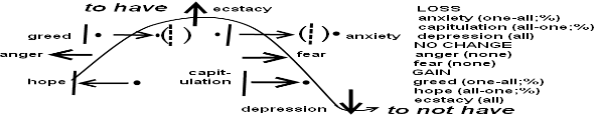
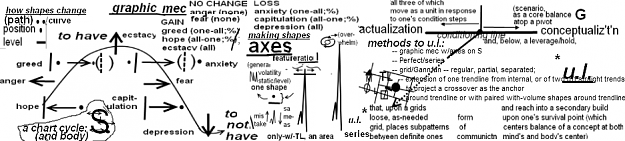
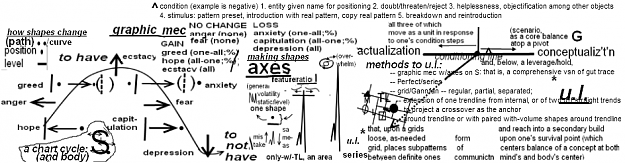
(A trend's angle points either convexly or concavely, that is, as an innie or an outtie. Drops that are outties to the right side of the chart tend to keep falling, and when innies there, tend to return. I'm not sure about rises, yet. And, the entire proposal may be bunk. My second proposal on this is, regardless of direction: Trend angles -- innie returns, outtie continues, neutral stays at level)
(When viewing the charts below, please ignore the lines described in the same chart above.)


-----
a slight change to post#1:
(replaces old "measure" section)
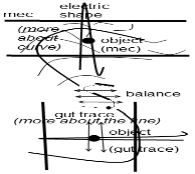
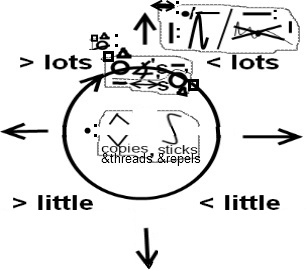
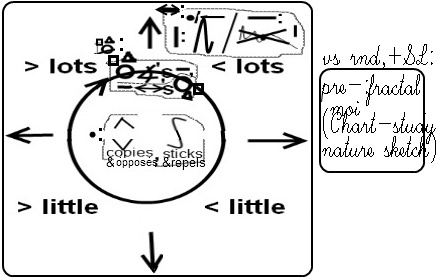
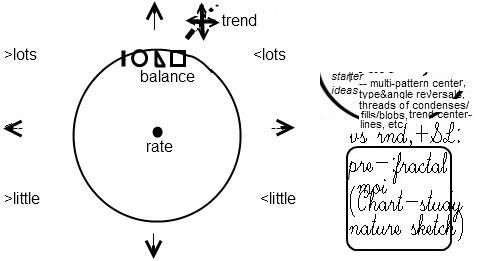
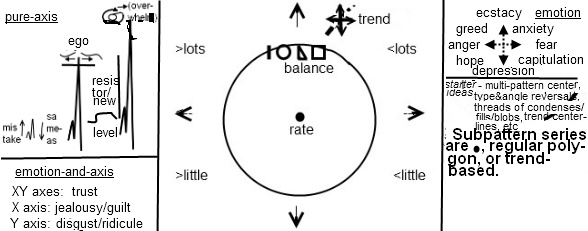
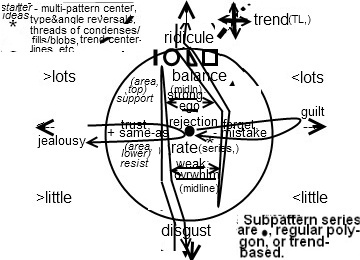
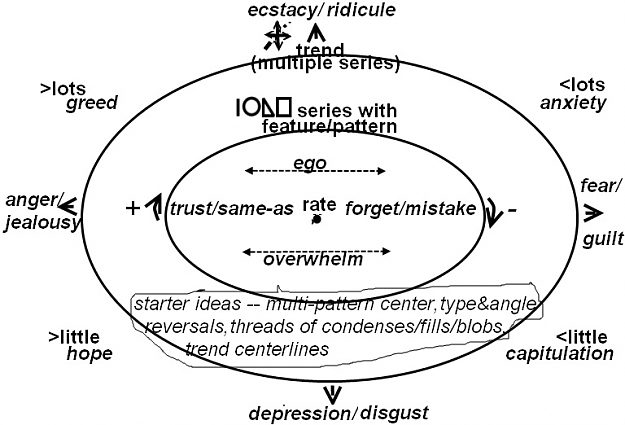
measure geometry (dot,line,curve, ellipse,triangle,rectangle, 50%,momo%; condense, blob), opp-copy >H Shapes -- perfect/parallel <-> random/serial. >V Trend angles -- innie returns, outtie continues, neutral stays at level; this is more exact than saying a collapsed trend returns, etc. balance -- (~ ff, gut trace, attitude, for a person): L or R vectors, on the horizontal and with one dominant, for each of high, middle, low areas; and, dot within an angled balance of an area or angled line that balances an area, for each of the top of the high, center of the middle, and bottom of the low area.
replaced an older idea:
measure geometry (dot,line,curve, ellipse,triangle,rectangle, 50%,momo%), opp-copy >H Shapes -- perfect/parallel, condense/blob, random/serial. >V Trend angles -- innie to right returns, outtie to right continues, neutral stays at level reached; this is more exact than saying a collapsed trend returns, etc. balance -- (~ ff, gut trace, attitude, for a person): L or R vectors, on the horizontal and with one dominant, for each of high, middle, low areas; and, dot within an angled balance of an area or angled line that balances an area, for each of the top of the high, center of the middle, and bottom of the low area.
-----
another idea:
(this one is not very effective in predicting direction, except for the very next trend's direction; and, which one a trend angle is, in or out, is often tricky to tell)


-- crossover dot (or point). I've done these before, notably with l.p.3; only, the crossover dot itself served as a neutral balance for the TL's crossing at it, a screen so to speak. The crossover dot was very much in the past, with lots of confirmation after the dot from PA for the multiple TL's.
Now, I believe I have a good handle on how to project a crossover dot into the future. This'd have at least a couple of applications, first and foremost in dramatically increasing trade precision, and secondly in projecting l.p.3's (which, when it works, is as good as or better than a Gann Fan).
Then, another example of a projected crossover dot:
Attached Image (click to enlarge)
----------
another idea, likely also well-worn
and then stated in a way that then fits into my way of tying everything together:
(A trend's angle points either convexly or concavely, that is, as an innie or an outtie. Drops that are outties to the right side of the chart tend to keep falling, and when innies there, tend to return. I'm not sure about rises, yet. And, the entire proposal may be bunk. My second proposal on this is, regardless of direction: Trend angles -- innie returns, outtie continues, neutral stays at level)
(When viewing the charts below, please ignore the lines described in the same chart above.)
Attached Image (click to enlarge)
Attached Image (click to enlarge)
Attached Image (click to enlarge)
-----
a slight change to post#1:
(replaces old "measure" section)
measure geometry (dot,line,curve, ellipse,triangle,rectangle, 50%,momo%; condense, blob), opp-copy >H Shapes -- perfect/parallel <-> random/serial. >V Trend angles -- innie returns, outtie continues, neutral stays at level; this is more exact than saying a collapsed trend returns, etc. balance -- (~ ff, gut trace, attitude, for a person): L or R vectors, on the horizontal and with one dominant, for each of high, middle, low areas; and, dot within an angled balance of an area or angled line that balances an area, for each of the top of the high, center of the middle, and bottom of the low area.
replaced an older idea:
measure geometry (dot,line,curve, ellipse,triangle,rectangle, 50%,momo%), opp-copy >H Shapes -- perfect/parallel, condense/blob, random/serial. >V Trend angles -- innie to right returns, outtie to right continues, neutral stays at level reached; this is more exact than saying a collapsed trend returns, etc. balance -- (~ ff, gut trace, attitude, for a person): L or R vectors, on the horizontal and with one dominant, for each of high, middle, low areas; and, dot within an angled balance of an area or angled line that balances an area, for each of the top of the high, center of the middle, and bottom of the low area.
-----
another idea:
(this one is not very effective in predicting direction, except for the very next trend's direction; and, which one a trend angle is, in or out, is often tricky to tell)
Attached Image (click to enlarge)
Attached Image (click to enlarge)
Attached Image (click to enlarge)