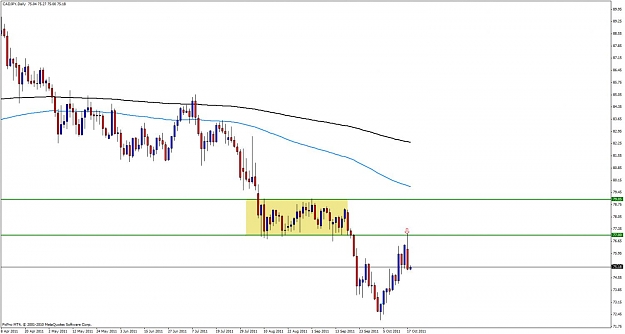
Hi, been out of action for a few days as I was sick. Lots to catch up here. Any seniors out there give advice as to which of these 3 daily setups are the best? All 3 are BEOB (I'm not sure if AUDUSD qualifies as one though as it didn't close near its day's low)
I personally prefer the AUDJPY and NZDUSD setups the best, looks cleanest with BRN above as resistance. Pls give your comments. Thks
It's a beob on my feed since it has a higher high then previous bar, a lower low then previous bar and a close near the bottom of the bar(in this case lower then previous bars low).
Technically it's a BEOB in that the high and low are both higher and lower than that of the previous bar. In this case, on my feed, the close of the bar is actually 1 pip below the previous bar's low. I wish it engulfed a little more, but the other factors tip the scales for me and are the reasons I go short - it's gotta be more than just the bar. (I took a zoomed shot that shows that it does engulf, just slightly though).
Those are:
[list][*]Location of the Price Pivot Zone in confluence the big round number of 80, at a nice swing high. Location...
A beob simply has to meet the following criteria to be a BEOB(doesn't mean you trade it if it meets the criteria, simply what is considered a beob)
So for a beob
You want a high higher then the previous bars low.
You want a low lower then the previous bars low
You want the close to be near the bottom portion of the bar
So for aud/jpy we can see we meet all those criteria to be called a beob.
The candle conists of the body and the wicks (body reps open/close, wicks high/low).
Min requirements as I see them on the bearish engulfing (represented by body), the close has to be lower than the open and the high and low must be higher and lower respectively than those of the previous bar. A couple of things can give the bar more strength - closing lower than the previous bars close and engulfing a range of bars are 2 that come to mind.
The opposite is true for BUOB as far as open and close - close must be higher than the open.
Take a look...
Ignored
Indicators show the past. Price Action "Indicates" the future.
Yeah, I hear you. I see a bounce at a resistance area and am calling them all the same thing.
Got to work on that.
Ignored
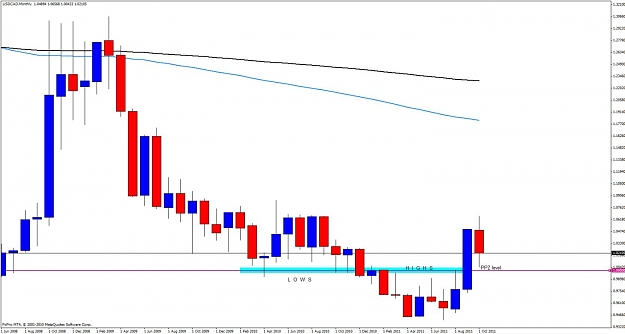
Parity is a great level to watch especailly when there are confluences that align with them. PA at these levels are a great confirmation as to where Price may be heading. Also, when PBT&CAorB at these levels for a Touch Trade can also be played.
Indicators show the past. Price Action "Indicates" the future.
Jarroo,
Thanks for info. But I'm still not 100% clear abt the AUDUSD bar whether its considered BEOB becos technically it is (its engulfing), but the last point on Mike's post that it has to close near the bottom of the bar....hmm it kinda doesn't fulfill this criteria does it? Sorry am not really thinking straight today
Ignored
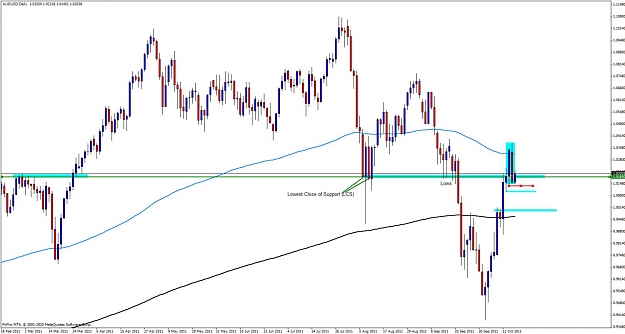
I do like that it Closed below a strong level, the 1.0850ish. It does have good potential of hitting its targets (previous bar Highs/Lows) if or when it breaks the BEOB. A sell stop below the BEOB would not be a bad play at all ..
Should be fun to watch or demo . .
Jim
Attached Image (click to enlarge)
Indicators show the past. Price Action "Indicates" the future.
Nice GH. . .Classic . . . .that 30min beob turned into some nice higher time frame (Hourly, 4 Hour) bearhish PA as well . .
Ignored
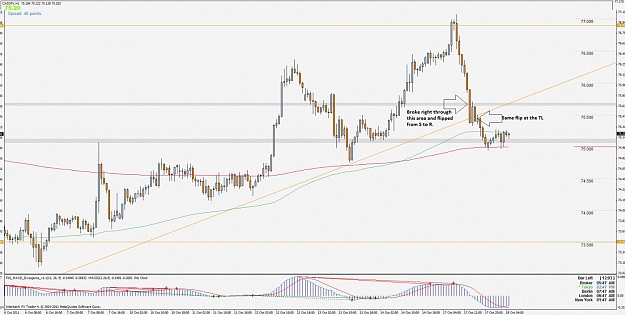
Yeah, I was watching that setup GH mentioned.
I like how on the H1 tf, it showed its hand at the FTA & TL and this area quickly flipped from support to resistance, with only a minor hiccup.
I don't think I will take this trade, but I would like to hear your opinion.
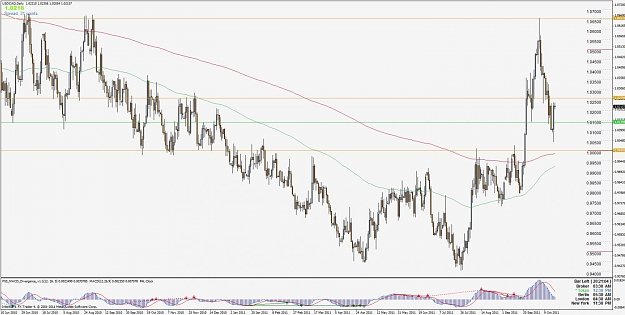
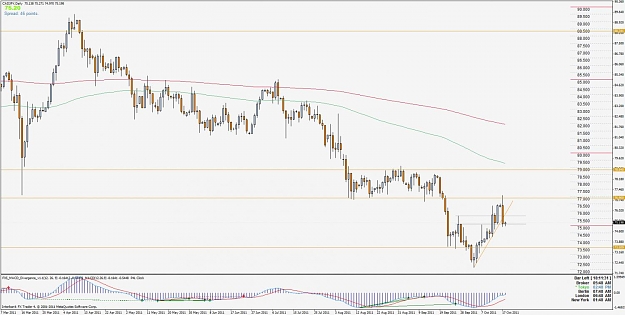
It is DBLHC on USDJPY. 23.6 Fib confluence. Long term downtrend, but right now we are in consolidation. There is not much space between the previous bar low and the bottom lows. Plus FTA would be very close - 76.470 (if we enter the trade under last bar low)...so maybe a B trade? :-)
I don't think I will take this trade, but I would like to hear your opinion.
It is DBLHC on USDJPY. 23.6 Fib confluence. Long term downtrend, but right now we are in consolidation. There is not much space between the previous bar low and the bottom lows. Plus FTA would be very close - 76.470 (if we enter the trade under last bar low)...so maybe a B trade? :-)
Ignored
I agree, good observation.
Maybe if those Three Bar highs break, it will finally break out of this sideways movement. Note the winding up in the triangle.
First I would like to thank to Pinbar for his comment on my previous post - thank you Pinbar
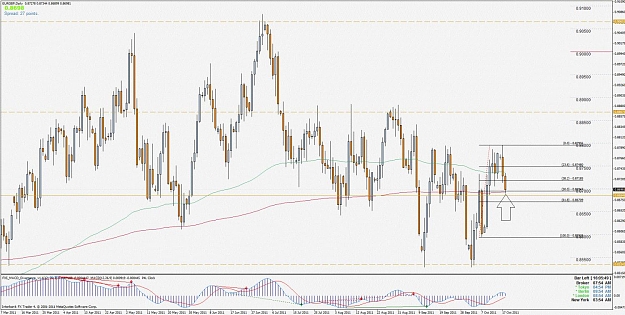
And here is a trade I take today, any comment is appreciated.
It is BEOB on EUR/GBP.
Bullish bar high a little below Fib 50, then price broke through Fib 38 and closed below previous bearish bar (I don't count the sunday bar).
Conflunce - high of the bullish bar with previous bars highs (not exactly the same high and like 20 bars to the left, but its there).
FTA - the 365 EMA - so I took partial profit and placed the SL to BE.
Profit Target - I think the 23 Fib - what do you say?
In the future I will try to mark the confluences and so on to the graph, I guess its kinda messy when I type it here
First I would like to thank to Pinbar for his comment on my previous post - thank you Pinbar
And here is a trade I take today, any comment is appreciated.
It is BEOB on EUR/GBP.
Bullish bar high a little below Fib 50, then price broke through Fib 38 and closed below previous bearish bar (I don't count the sunday bar).
Conflunce - high of the bullish bar with previous bars highs (not exactly the same high and like 20 bars to the left, but its there).
FTA - the 365 EMA - so I took partial profit and placed the SL to BE.
Profit Target - I think...
Ignored
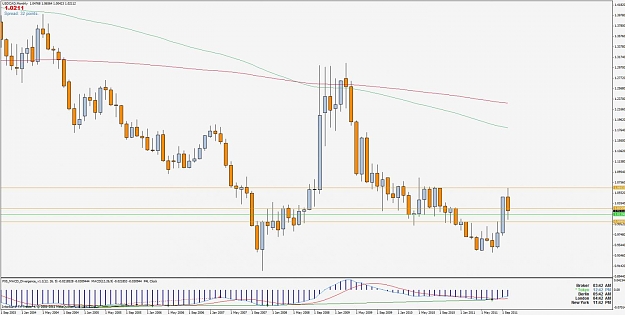
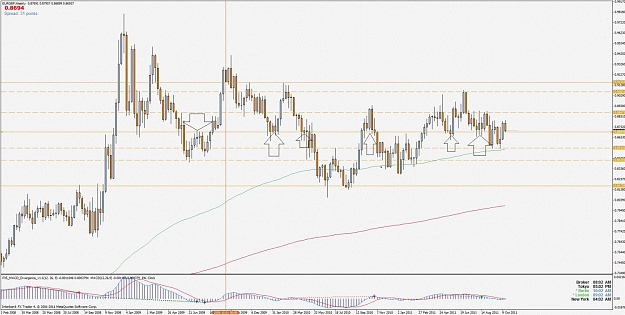
I'd watch out for this Monthly PPZ that has confluence with the FTB to the 365 EMA & the 50 fibo. This area could act as strong support, until we get a daily close below it.
But, as you are already at BE, it is not so crucial. Good job.
First I would like to thank to Pinbar for his comment on my previous post - thank you Pinbar
And here is a trade I take today, any comment is appreciated.
It is BEOB on EUR/GBP.
Bullish bar high a little below Fib 50, then price broke through Fib 38 and closed below previous bearish bar (I don't count the sunday bar).
Conflunce - high of the bullish bar with previous bars highs (not exactly the same high and like 20 bars to the left, but its there).
FTA - the 365 EMA - so I took partial profit and placed the SL to BE.
Profit Target - I think...
Ignored
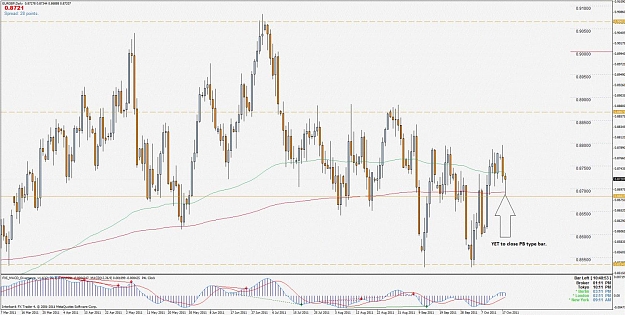
See, currently we have a PB type pattern forming on this daily bar, which has Yet to close. But, I am sure you can see what I meant by the last reply when I said that, there was some serious support beneath this bar. The rule of thumb is, we want to be taking PA away from these strong areas of support, not into them.
This is not a trade recommendation, especially as there is no Space to the FTA if this current bar closes just above the open.