Hi Rocky,
I m really thankful that you started this thread. I have been following sam sieden's video for a while now. I could draw the levels somewhat correctly but never knew why they broke or held, until i came upon your thread. The way you have added HF trendlines and Fibs for confluence is pure genius.
Thanks a lot for this method.
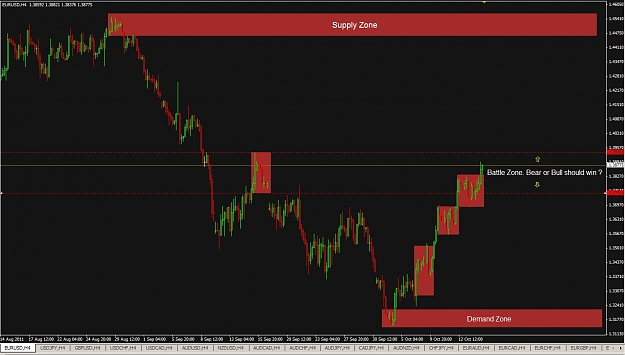
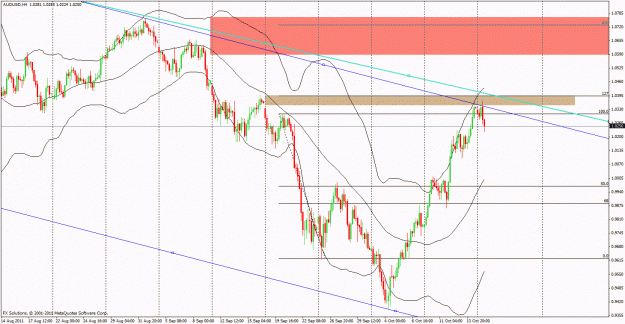
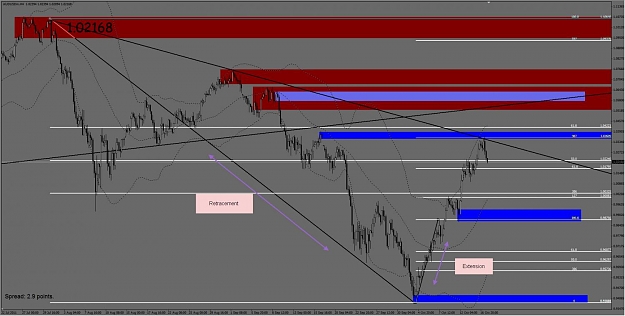
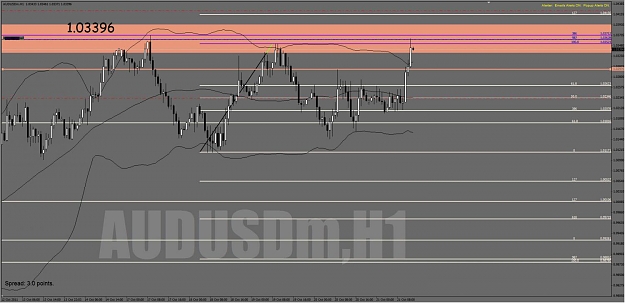
Now, i know some members here have problem identifying supply and demand levels. There is one indicator to identify this. Don't worry it wont repaint. It will merely remove the level if not held.
Also Rocky if you could test this indicator and see if levels match with your method. I have been testing this indicator with other indicators and it works.
The reason for using this indicator is it helps identify levels that you may not see sometimes and also it gets tedious to draw them sometimes.
Also, Rocky one more request. if you could document your method/Strategy using Supply demand/Fibs/Trendlines in a nice PDF. It would be great. I can help.
I m really thankful that you started this thread. I have been following sam sieden's video for a while now. I could draw the levels somewhat correctly but never knew why they broke or held, until i came upon your thread. The way you have added HF trendlines and Fibs for confluence is pure genius.
Thanks a lot for this method.
Now, i know some members here have problem identifying supply and demand levels. There is one indicator to identify this. Don't worry it wont repaint. It will merely remove the level if not held.
Also Rocky if you could test this indicator and see if levels match with your method. I have been testing this indicator with other indicators and it works.
The reason for using this indicator is it helps identify levels that you may not see sometimes and also it gets tedious to draw them sometimes.
Also, Rocky one more request. if you could document your method/Strategy using Supply demand/Fibs/Trendlines in a nice PDF. It would be great. I can help.
Attached File(s)