DislikedAnother question on SS's theory.
He mentioned that S/D trading style based on the order stacks. And this trading works on any timeframe.
Then let's say we go to monthly TF. some S/D levels can easily be drawn by going way back, let's say 2000. Are we saying that there are orders back in 2000 that being sorted by the clerks are still valid?
For some reason, I highly doubt that. Please elaborate how that works.Ignored
I tend to agree with you but , On those longer time frames those levels become more like ultimate stops . A country may not allow the price to move past or even large commercial traders. I don't go as high as a month , even weekly has stops I can't afford. but I would take notice of that level then still play it as a supply level looking for shorts on my daily and lower charts. I noticed on one of Sam's webinars , they had plotted a supply zone on a weekly chart and he took 3 separate days shorts on it off a 2 min chart. The level was eventually breached. But his losses were small using that fast of a chart, That is how I would treat those levels.
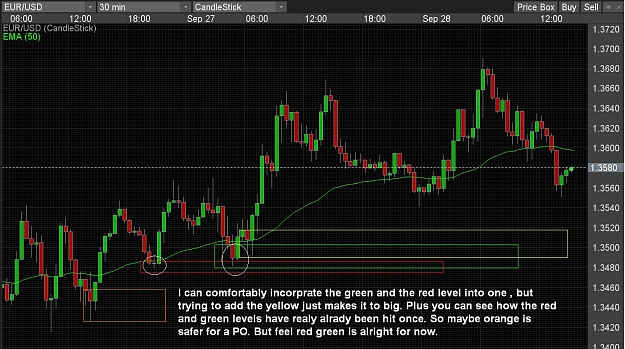
Like today on my 30 min charts longs still looked good, But on a 4 hr we have hardly had any retrace. So still very strong downtrend. The best way to trade S/D is to find levels off large charts 4 hr or greater , then look for trades on faster charts that agree with the larger chart.
So a real obvious supply level on a Daily chart. Look for shorts. if it is a demand level look for longs.you can zoom it down lower and lower getting a tighter entry all the way.
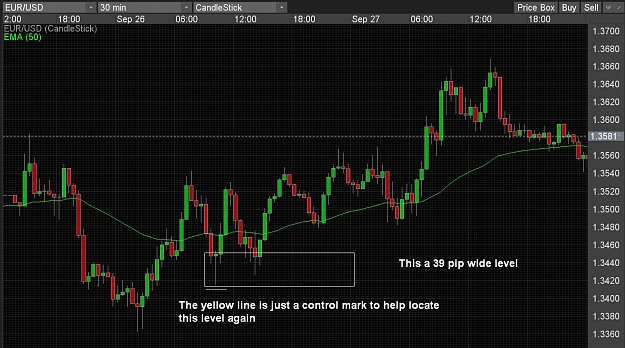
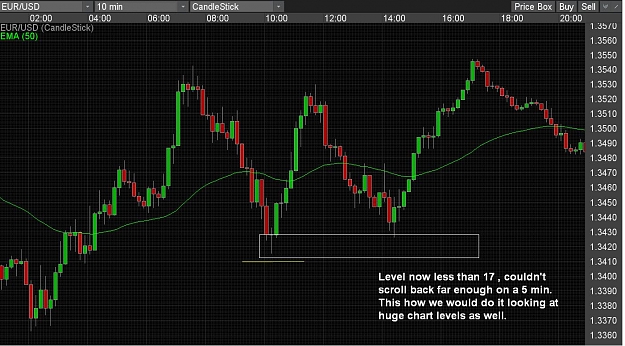
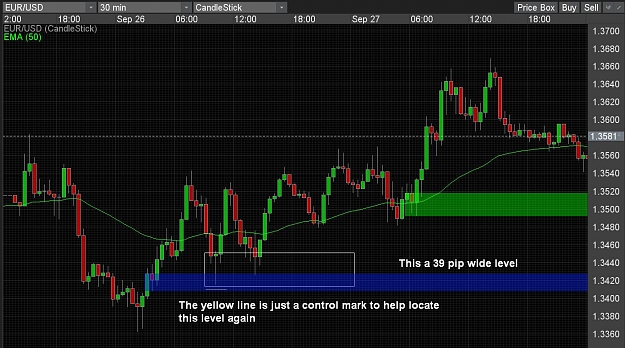
Say the daily has a 100 pip wide level. so you zoom to the 3 hr and find a 45 pip level. Then 30 min it is 20 then at 5 min it maybe less than 10.
This is how it can and does work trouble is that the faster the chart the less clear the levels become. So Plot them on your 30 min or hrly then look for the best entry on a 5 min maybe. I trade pretty much just the 30 min .
using 4 hr and daily for the bigger picture.
Hope this helps. If not maybe zoom down the question more specific. ken
I am making a PDF and that will be in it at the end . Takes a good while to build charts to show a decent response.
Good Trading To All ; Ken Lee