Joined Jan 2006
|
Status: Monarch o' the Glen
|5,561 Posts
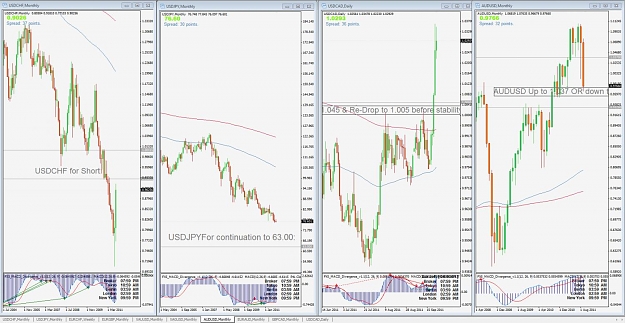
Did anyone notice that USDCAD is back above Parity?
OPPORTUNITYISNOWHERE.
Watch List:
USDCHF for Short:
USDJPYFor continuation to 63.00:
EURCHF for cont. Up to 1.2623 before Drop:
EURGBP Blender. Aside:
GOLD 1,682 as hinge:
SILVER Could be a bounce to 35.10 or continuation to 27.20:
AUDUSD Up to 1.037 OR down to 0.9325:
EURAUD Down to 1.2560:
GBPCAD Up to 1.6100 IF it breaks back into the Channel:
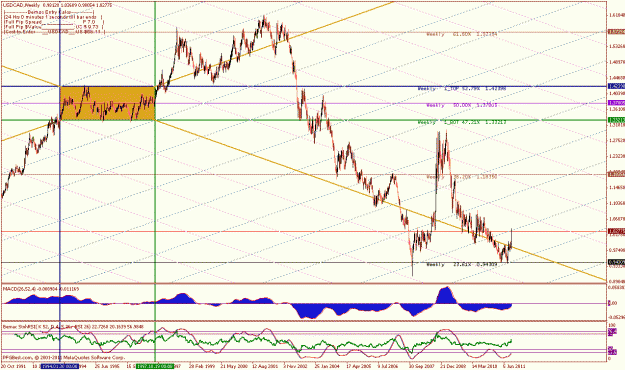
USDCAD Challenge 1.045 & Re-Drop to 1.005 before stability.
Joined May 2010
|
Status: HCR-LCS SFP
|6,026 Posts
Nothing on my charts but these pairs and trying to work out the logical reasons for them, Don't have much time time right now as I have to go to work but, I was wondering if the USD/JPY pair has a typo. I mean, did you really mean continuation to 63?
Did anyone notice that USDCAD is back above Parity?
OPPORTUNITYISNOWHERE.
Watch List:
USDCHF for Short:
USDJPYFor continuation to 63.00:
EURCHF for cont. Up to 1.2623 before Drop:
EURGBP Blender. Aside:
GOLD 1,682 as hinge:
SILVER Could be a bounce to 35.10 or continuation to 27.20:
AUDUSD Up to 1.037 OR down to 0.9325:
EURAUD Down to 1.2560:
GBPCAD Up to 1.6100 IF it breaks back into the Channel:
USDCAD Challenge 1.045 & Re-Drop to 1.005 before...
... I was wondering if the USD/JPY pair has a typo. I mean, did you really mean continuation to 63?
Ignored
Well no... Now that you called me on it...
I'm actually looking At 62.89.
Confirm...
Yep. 62.898 as a matter of fact.
If I am wrong... then
86.935 will be Resistance.
PB. This disconect from Account Value to Smart Trade is a Learned Skill.
A tough one to learn but it is a Learned trait that can be taught.
You know what I mean.
PM me the Pairs you follow.
B
Ignored
Thanks B
As I was reading the "Now that you called me on it", I was thinking my eyes were going to see the digits 73. They did not fall upon that number. LOL
Right now, these are the only pairs, I am looking at & following.
Nothing on my charts but these pairs and trying to work out the logical reasons for them, Don't have much time time right now as I have to go to work but, I was wondering if the USD/JPY pair has a typo. I mean, did you really mean continuation to 63?
Ignored
First:
I know that a 12 26 & 9 MACD Makes some sense if you don't understand what they measure but I would bet London to an Orange you have never considered shifting that ratio.
Same goes for All Oscillators. Stohs included. RSI too.
Attached Image (click to enlarge)
Have you actually ever researched what Info they are providing?
ps. to the Readers. Don't start with the Lagging Indi Sh.tuff. I cannot educate those unwilling.
North a bit more 1.044xx & then the turn (return) to
1.000
B
First:
I know that a 12 26 & 9 MACD Makes some sense if you don't understand what they measure but I would bet London to an Orange you have never considered shifting that ratio.
Same goes for All Oscillators. Stohs included. RSI too. Attachment
Have you actually ever researched what Info they are providing?
ps. to the Readers. Don't start with the Lagging Indi Sh.tuff. I cannot educate those unwilling.
North a bit more 1.044xx & then the turn (return) to
1.000
B
Ignored
Bemac
I understand that MACD measures the difference in the EMAs based on how many days it is set for, no more than that.
I have experimented with other setting on the RSI not the MACD, for the simple reason that someone once told me that 12, 26, 9 is the best setting as most people will be looking at those settings & we want to move with the crowd, not against it.
Got to go to work, will eagerly follow this when I get back.
I understand that MACD measures the difference in the EMAs based on how many days it is set for, no more than that.
I have experimented with other setting on the RSI not the MACD, for the simple reason that someone once told me that 12, 26, 9 is the best setting as most people will be looking at those settings & we want to move with the crowd, not against it.
Ignored
let's just look at Daily.
12 Makes sense. 12 Bars on Daily = 2 Weeks of Measure.
26 bars on Daily = what?
9 Bars of the Avg. result on Daily = what?
If you haven't noticed yet... My MACD, Stoh & RSI vary from TF to TF.
Just another little arrow I carry.
I understand that MACD measures the difference in the EMAs based on how many days it is set for, no more than that.
I have experimented with other setting on the RSI not the MACD, for the simple reason that someone once told me that 12, 26, 9 is the best setting as most people will be looking at those settings & we want to move with the crowd, not against it.
Got to go to work, will eagerly follow this when I get back.
I have the feeling this, could turn into an epic.
Ignored
Not sure who is credited with the Original MACD but I do beg to offer an opinion.
Why; If i am looking at a 1Hr Chart should I be remotely interested in an EMA of the last 12 Bars as compared to the last
26 bars.
And then Trade based on a 9 bar average the above?
No. I think it has merit but is most often missused.
Think. Can you do that?
Think your way to success.
Just like regular pin bars don't expect IPBs to be reversing trends all the time.
The mosrt conservative way to play these (and they way I play them) is to take full profit before the bar low (in case of a bearish IPB) is hit. Notice that in this case we are not damaging the over all story by taking a short term trade to the short side. This is similar to what you do with an A+ bearish pin bar against a decent uptrend. You still go for it but you know that expecting 500 pips out of it is not the right thing to do.
Again that doesn't go on to...
Ignored
Hi ghous,tks for the answer,but I think is a misunderstanding!
My post was only an interpretation for another perspective of the price within the range market and how the old consolidation's resistence acted as support with the dblhc,and non an interpretation of the last candle as an IPB.
Waiting for this pair to close above 3500 as confluence of BRN with Fib and TL looks good.
Ignored
I think you're drawing the trendline wrong - don't connect a point from the chart with your current bar, with nothing between them. You can always draw a trendline like that(there's always a line between two points).
you need at least two previous closes to define a trendline. Not a previous close and the current one - that holds no significance, you'll always be able to draw a line between them.
Interesting but, on my broker feed, it looks completely different on the daily, neither of the last two bars appear to be pinbars.
It looks a little better on my 240 minute chart but there's horrible looking traffic congestion to the left with an FTA around about 30 pips away from current price, also on my 240 chart there is a much nicer looking bullish pin that precedes the other two, unfortunately it was almost at a mini high, for me I would have liked to have seen it close a little lower down just above the PPZ that I have marked up with...
Ignored
Man, it's quite frightening to know that broker feeds are so diverse, even on the daily!
Joined May 2010
|
Status: HCR-LCS SFP
|6,026 Posts
Just a little bit about the MACD in case any other newbies like myself are interested.
Developed by Gerald Appel in the late seventies, Moving Average Convergence-Divergence (MACD) is one of the simplest and most effective momentum indicators available. MACD turns two trend-following indicators, moving averages, into a momentum oscillator by subtracting the longer moving average from the shorter moving average. As a result, MACD offers the best of both worlds: trend following and momentum. MACD fluctuates above and below the zero line as the moving averages converge, cross and diverge. Traders can look for signal line crossovers, centerline crossovers and divergences to generate signals. Because MACD is unbounded, it is not particularly useful for identifying overbought and oversold levels.
That being that while I was working out the MACD calculations which may or may not be incorrect, I noticed you are using the stochastic and RSI and wonder why you prefer them to the MACD?