• Home
  • Forums
  • Trades
  • News
  • Calendar
  • Market
  • Brokers
  • Login
  • Join
  • User/Email: Password:
  • 11:15pm
Menu
  • Forums
  • Trades
  • News
  • Calendar
  • Market
  • Brokers
  • Login
  • Join
  • 11:15pm
Sister Sites
  • Metals Mine
  • Energy EXCH
  • Crypto Craft

Options

Bookmark Thread

First Page First Unread Last Page Last Post

Print Thread

Similar Threads

seeking indicator - auto fibo of previous time frame (week) 3 replies

Seeking LWMA crossover alert indicator w/shift 12 replies

Seeking Trading Indicator with 50%+ success 24 replies

Seeking Consolidated Profit Indicator 0 replies

Seeking a volume indicator that.. 0 replies

  • Platform Tech
  • /
  • Reply to Thread
  • Subscribe
  • 5
Attachments: Seeking Volatility Indicator
Exit Attachments
Tags: Seeking Volatility Indicator
Cancel

Seeking Volatility Indicator

  • Last Post
  •  
  • 1 Page 2
  • 1 Page 2
  •  
  • Post #21
  • Quote
  • Sep 6, 2011 8:33am Sep 6, 2011 8:33am
  •  bug
  • Joined Jan 2010 | Status: cash is a position too | 958 Posts
Abinadi,
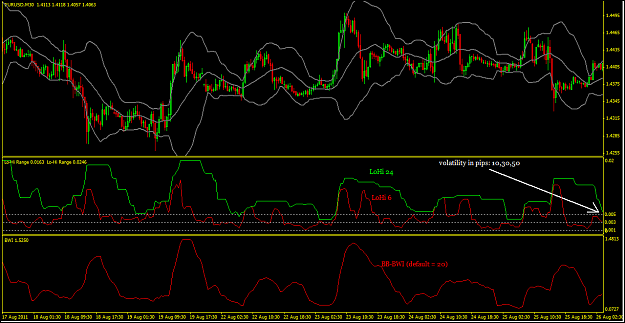
I hope you're still subscribed to this thread, because I have a suggestion for you. I am currently researching volatility myself and I was thinking maybe you could do well to try out the classic Donchian channel indicator in another form. The Donchian channel draws channels connecting the highs and lows of n periods. When volatility increases, the channel gets wider. There is an indicator called Donchian Channel Width that measures exactly that (the same principle is used on the BB width indicator, which I too think is too slow most of the time). The results are displayed in a separate window. To get a better reading of volatility, I placed two indicators in the same window (just drag and drop the second on top of the first one) with different values. That way you can get a sense of the session's volatility as well as the immediate volatility.

The settings I chose for the chart below are random - to figure out the best ones you would have to test it out yourself. I don't use the indicator myself but I have it in my arsenal. Also, if you are going to use two indicators in the same window make sure you set identical fixed minima and maxima to both indicators. Otherwise the comparisons are worthless.
Attached Image (click to enlarge)
Click to Enlarge

Name: LoHi.PNG
Size: 66 KB
Attached File(s)
File Type: mq4 LoHi.mq4   2 KB | 2,612 downloads
If you don't risk, you don't ever have to lose.
 
 
  • Post #22
  • Quote
  • Sep 7, 2011 8:50am Sep 7, 2011 8:50am
  •  EKnockers
  • | Joined Jul 2011 | Status: Formerly BigE! | 13 Posts
Abinadi,

If you haven't already done so, check out the Online Library of the Meta Editor under Indicators. There is a weath of information there.

Click View, Toolbox, then at the bottom of the toolbox window, click Online Library. Under the Indicators Tab, use the search box to find volatility indicators. Double click on the one(s) you want to check out. You can download from there.
 
 
  • Post #23
  • Quote
  • Sep 22, 2011 10:12am Sep 22, 2011 10:12am
  •  Abinadi
  • | Joined Aug 2008 | Status: Be grateful for any and all profits | 102 Posts
Thanks to each of you, 919gilead (Aug2010), bug (Sep2011) and EKnockers (Sep2011) for your response and input. I'll be researching each of these ideas.

I really appreciate each of you and your interest and willingness to share.
 
 
  • Post #24
  • Quote
  • Edited 2:13am Sep 30, 2011 1:59am | Edited 2:13am
  •  Drey
  • | Joined Sep 2011 | Status: Member | 21 Posts
I have found something to share here. The only Bug that i have with it, is that in the Color Tab.
The Settings for the Thickness of the Histograms switches back to what it was originaly. After switching Timeframe.
You can open the mq4 in the Editor to set the Parameters to what you like and press the compile Button.
Find these lines ->
SetIndexStyle(0,DRAW_HISTOGRAM, EMPTY, 1);
SetIndexStyle(1,DRAW_HISTOGRAM, EMPTY, 1);
and edit the Number after EMPTY

I downloaded this from a Site in a zipfile with other Indicators in it and the Founder of the indicator is Ivan Kornilov so the Credit for this, goes to him.
Attached File(s)
File Type: mq4 volatility.mq4   2 KB | 3,358 downloads
 
 
  • Post #25
  • Quote
  • Nov 10, 2013 5:17am Nov 10, 2013 5:17am
  •  Einoras
  • | Joined Nov 2013 | Status: Member | 4 Posts
Quoting Abinadi
Disliked
{quote} OK. Since a picture is said to be worth a thousand words (or is it 10,000?) I will rely on a screen shot to get my point across (click on attached GIF file). In this shot of the EU (EURUSD) H1 from today, this currpair made a run up causing the BB to go out to their 2.0 standard deviations. Then the bars narrowed down to a range of about 37 pips (1st red arrow). But if I am relying on a BWI (Bollinger Bandwidth Indicator) to measure volatility, when I come around to look at this currpair, the BWI is showing me a 298 pip bandwidth (look to...
Ignored

Hi Abinadi can I ask u whats a indicator is on your chart in yellow, green and red dots,and can u share the indi.

thanks in advance
 
 
  • Post #26
  • Quote
  • Jun 6, 2014 4:43pm Jun 6, 2014 4:43pm
  •  mcrious
  • | Joined Jun 2014 | Status: Junior Member | 2 Posts
Quoting finally
Disliked
{quote} Actually, Volume Data is not misleading because it measures the amount of price changes per bar. A central clearing house is not necessary. I find it to be a very reliable way to measure changes in volatility. As the price changes per bar drops off, interest in the market declines. This is why the volume bars are usually quite small between Noon-Midnight (EST), because no one really has an interest at this time. The real question is how are you going to profit from trading when volatility is higher. I wish it was so simple as to make it...
Ignored

Volume is misleading cos the broker decides on MT4 how are the criterias.for example short against long results zero if ten buyers and ten sellers are around.
or you can look the pos numbers only or the position size etc,you get the point.One possibility is to use a range bar instead of timeframes.
So u can set a range of 5pips and everytime the prize moves 5pips there shows a new bar ore candle(candle is the wrong word cos you have high and close together or low and close) up.
then you have only to set in the time levels and you see the periods when there are a lot of candles is high volatility etc,also historical on the chart history backwards.
example :
http://www.forexfactory.com/showthread.php?t=340925
 
 
  • Post #27
  • Quote
  • Oct 21, 2019 8:47pm Oct 21, 2019 8:47pm
  •  ya2ndgen22
  • | Joined Apr 2019 | Status: Junior Member | 2 Posts
you guys are all using faulty methods to measure volatility. Let an options trader tell you: USING ATR, BB, OR ANY LAGGING INDICATOR TO TELL YOU VOLATILITY IS A LAGGY AND CRAPPY WAY TO MEASURE. Think about it. Ever heard of Implied volatility versus realized volatility? Every time major volatility happens, what happens next? There is calm. What happens right before volatility? Calm. Best method is A. Use implied volatility, B. Use the Forex "VIX" found in CBOE or barcharts, the symbol for EUR is $EVZ, JPY is $JYVX, and GBP is $BPVX. These can be used to measure where volatility is at, similar to how the VIX is used for the Indices. There are other ways but I'm not gonna spend too much free service time lecturing noobs as I'm busy trading real and profitable strategies. Bye.
 
 
  • Post #28
  • Quote
  • Dec 7, 2019 5:07pm Dec 7, 2019 5:07pm
  •  freezfate
  • | Joined Dec 2019 | Status: Junior Member | 1 Post
Quoting ya2ndgen22
Disliked
you guys are all using faulty methods to measure volatility. Let an options trader tell you: USING ATR, BB, OR ANY LAGGING INDICATOR TO TELL YOU VOLATILITY IS A LAGGY AND CRAPPY WAY TO MEASURE. Think about it. Ever heard of Implied volatility versus realized volatility? Every time major volatility happens, what happens next? There is calm. What happens right before volatility? Calm. Best method is A. Use implied volatility, B. Use the Forex "VIX" found in CBOE or barcharts, the symbol for EUR is $EVZ, JPY is $JYVX, and GBP is $BPVX. These can be...
Ignored
To the point.. Bravo..!!
 
 
  • Post #29
  • Quote
  • Dec 7, 2019 8:19pm Dec 7, 2019 8:19pm
  •  failinforex
  • Joined Mar 2015 | Status: i have to Carry On | 540 Posts
What implied volatility says about this week's event risk

Just some info about implied volatility
 
 
  • Post #30
  • Quote
  • Last Post: May 25, 2020 10:47pm May 25, 2020 10:47pm
  •  totocayetano
  • | Membership Revoked | Joined Jul 2019 | 94 Posts
I have been using volatlity watcher and obos watcher successfully for sometime now. i can't remember the link but if you google it you will know where to download it.
 
 
  • Platform Tech
  • /
  • Seeking Volatility Indicator
  • Reply to Thread
    • 1 Page 2
    • 1 Page 2
0 traders viewing now
Top of Page
  • Facebook
  • Twitter
About FF
  • Mission
  • Products
  • User Guide
  • Media Kit
  • Blog
  • Contact
FF Products
  • Forums
  • Trades
  • Calendar
  • News
  • Market
  • Brokers
  • Trade Explorer
FF Website
  • Homepage
  • Search
  • Members
  • Report a Bug
Follow FF
  • Facebook
  • Twitter

FF Sister Sites:

  • Metals Mine
  • Energy EXCH
  • Crypto Craft

Forex Factory® is a brand of Fair Economy, Inc.

Terms of Service / ©2023