Disliked2 setups I've got my eye on for this week.
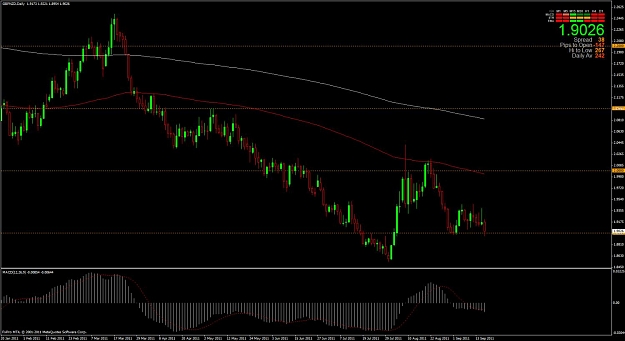
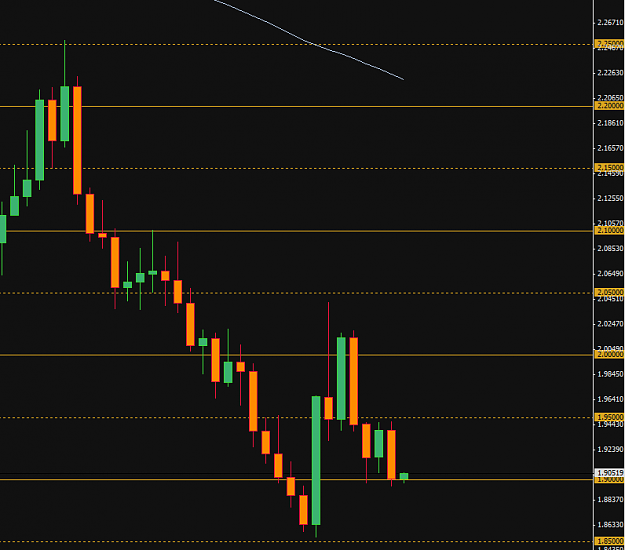
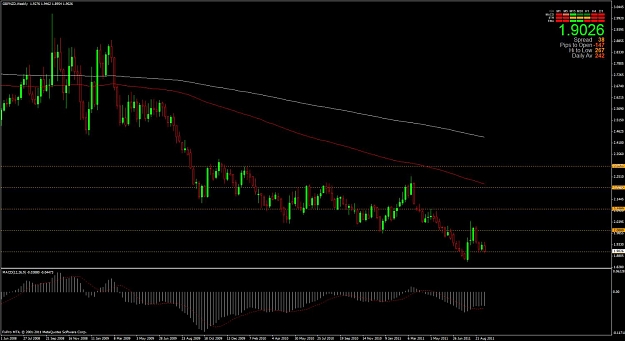
1. GBP/NZD - weekly is this a BEOB or a TBHLC off of 1.9500? Could be nice if it breaks the first blue box and heads down to the second/trendline on the daily.Ignored
Weekly
Attached Image (click to enlarge)
daily
Attached Image (click to enlarge)