Not usual for me to post on a SAturday because of work but nice to get some prep for next week in!!
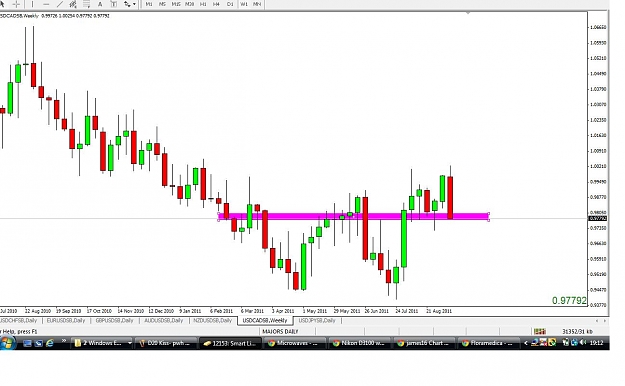
Just thought I would chime in with my 2 cents on UC Weekly BEOB. As I see it the close is almost exactly on a weekly PPZ so its possible it could react (Daily demand noted!) here and retrace a bit before continuing down.
Best play might be to wait for an entry on the daily4hr or use the weekly bar but with a generous buffer of say 25-30 pips. If it breaks the previous low at 9724 from 2 weeks ago then there is a good probability it could test the previous lows at 9440 area.
Definitely one to watch for next week and on my list!!
UC BEOB looks a tradable setup in my IMO..
how long it will last still in Q...
so will rethink over it again..
i like the location,size...also like it being CB 0.98.
retrace entry @ 0.98 looks good..
here is how i view the obstacles on Daily(2nd chart).(i find it comfortable managing weekly on dailies...)
Last week price broke and close below 1.38. Now price is retesting that region but weekly candle did not close above yet..Resistance coming from 150EMA, rising trendline, and 1.38RN. Interesting note, look back far enough almost every time the weekly candle close above/below 1.38, it continues in the direction it closes on for a while.
Ignored
Hi Dc
Some interesting analysis on this one. Euro retraced hard on Friday so maybe it will continue on down next week. One to watch and thanks for the heads up!!
UC BEOB looks a tradable setup in my IMO..
how long it will last still in Q...
so will rethink over it again..
i like the location,size...also like it being CB 0.98.
here is how i view the obstacles on Daily(2nd chart).(i find it comfortable managing weekly on dailies...)
Ignored
Nice analysis there AD and your levels to watch are spot on. A lot of traders will be watching this one so it will be interesting to see if it pans out. You could enter off the daily or weekly but I will hold back to see how it develops on Sun/Mon. Agree with you that it looks a decent setup.
I'm pretty new to it, and I've been digging through for a couple of days. Maybe someone did it before, anyway - I've downloaded all 380 charts posted by James16 since 2005, and made one archive of it. The archive can be found here. It's good to have it all in one place.
This business is not hard, but it never gives a crap what our desires are. It will just as easily chew up a new trader as it will reward a trader who is prepared to receive. All we are saying is evaluate your mind and figure out if your expectations are in line with those most likely to grant success. I found one of the best PDFs ever in a thread on FF and I believe that it encompases the entire journey most face in a few pages. I attached it and it is worth reading to evaluate where you are and how far you may have left to go. We will help you...
Ignored
Cheers Ryan, I just finished up watching 3 x 1 hour trading video's and it's now 2am here but I'll certainly read that pdf tomorrow
I'm pretty new to it, and I've been digging through for a couple of days. Maybe someone did it before, anyway - I've downloaded all 380 charts posted by James16 since 2005, and made one archive of it. The archive can be found here. It's good to have it all in one place.
I'm pretty new to it, and I've been digging through for a couple of days. Maybe someone did it before, anyway - I've downloaded all 380 charts posted by James16 since 2005, and made one archive of it. The archive can be found here. It's good to have it all in one place.
Hope this saves another newbie!
Thank you, James16, and everyone who contributes!
Ignored
Great effort Selecta. We appreciate the archive you put together.
It's just best to look for the most obvious areas where you see this s/r and the flip between s/r or as james calls them PPZ(price pivot zones). These types of areas can come in a variety of ways. I marked some areas on a chart
hope that helps
Mike
Ignored
So basically we are looking for obvious and strong s/r zones (PPZ) to wait for PA setups and target levels. Levels that have been tested and bounced off for several times over the days/weeks before, instead of the "smaller" s/r areas every grid level (every 50 pips)
Would it be accurate to say that?
An example would be this chart produced earlier in this thread:
Attached Image (click to enlarge)
The immediate PPZ would be at 1.7676but that isn't too relevant because it not a "major" support we are looking at. Hence he was aiming for 1.5400 or 1.7379 as those were the more important support levels.
It's just best to look for the most obvious areas where you see this s/r and the flip between s/r or as james calls them PPZ(price pivot zones). These types of areas can come in a variety of ways. I marked some areas on a chart
I'm pretty new to it, and I've been digging through for a couple of days. Maybe someone did it before, anyway - I've downloaded all 380 charts posted by James16 since 2005, and made one archive of it. The archive can be found here. It's good to have it all in one place.
Hope this saves another newbie!
Thank you, James16, and everyone who contributes!
Ignored
HeY Selecta
Welcome to thread and hats off to you for putting that archive together - I and I am sure many other traders will delve into it on a regular basis. Always good to see some examples of trads and charts from the man himself!
Hi guys, monster thread, and i've gone through about 100 pages or so already. Been making notes on the basic BEOB, BUOB, DBLHC, DBHLC and Pin bar setups, then taking this to some daily charts and just basically going through them to ID the setups, and get used to seeing them.
Once I got comfy doing that, I then added fibs from previous swing highs and lows to check for areas of confluence with the setups, and added my own take on PA S&R levels.
Looking at only taking the trades in line with the prevailing trend off the daily charts as well.
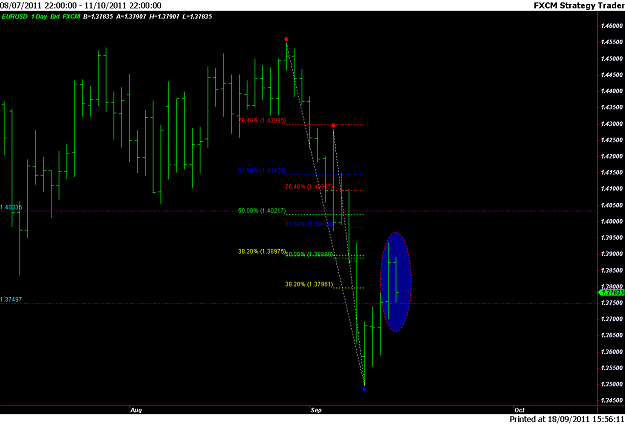
Just wanted to post up a chart and show my observations, and hopefully get some feedback. I'm using the most recent up to date EURUSD data for this.
EURUSD DAILY CHART
Attached Image (click to enlarge)
Quick description of chart
1) Purple lines are my lines of S&R based off previous price action observations.
2) Quite obvious down trend on EUR$. Looking to sell rallies in a downtrend.
3) Bearish inside bar in the blue ellipse
4) Fibs from red arrows to swing low blue arrow.
5) Confluence of fibs on current price action at 38% from 1st red arrow. 50% from 2nd red arrow.
6) Low of inside bar already at a support level at 3750. Already know from Fridays price action that is a strong support area.
7) Next area of support at swing low blue arrow. Also sits on round number of 3500.
That's my analysis of the chart. My question is this....Q: Is the inside bar a valid trade setup, or is the inside bar setup more of an observational one?
I know that if this chart was exactly the same but the setup in the blue ellipse was a BEOB, it would be a potentially exciting setup.
IF I was going to go short this setup, I'd like to see where price opened tonight. Ideally wait for a 50% retrace of Fridays bar for a nice entry.
Hi guys, monster thread, and i've gone through about 100 pages or so already. Been making notes on the basic BEOB, BUOB, DBLHC, DBHLC and Pin bar setups, then taking this to some daily charts and just basically going through them to ID the setups, and get used to seeing them.
Once I got comfy doing that, I then added fibs from previous swing highs and lows to check for areas of confluence with the setups, and added my own take on PA S&R levels.
Looking at only taking the trades in line with the prevailing trend off the daily charts as well.
Just...
Ignored
good day picon. what u saying is making sense. but goin to the weekly chart we find a piercing line pattern on da 61.8 fib with confluence of a rn and r. so from my opinion this inside bar is not a valid setup due to the mentioned above . but the price can retrace down befor goin hight again but there r 2 things to watch a ppz on da 38.2 and 1.400 level and finaly we can wait till the close of the candle tomorrow to see what is going on cauz usually it is better to wait till monday closing candle befor making a setup ....
|
Joined Feb 2010
|
Status: Make Them Pay
|1,103 Posts
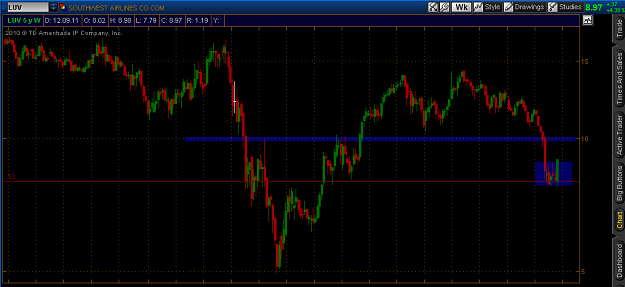
2 setups I've got my eye on for this week.
1. GBP/NZD - weekly is this a BEOB or a TBHLC off of 1.9500? Could be nice if it breaks the first blue box and heads down to the second/trendline on the daily.
|
Joined Feb 2010
|
Status: Make Them Pay
|1,103 Posts
Anyone discussed the weekly BEOB on USD/CAD? (Sorry haven't had time to read back over the thread!) Possible no brainer down to .9650, preferably with some kind of pullback entry